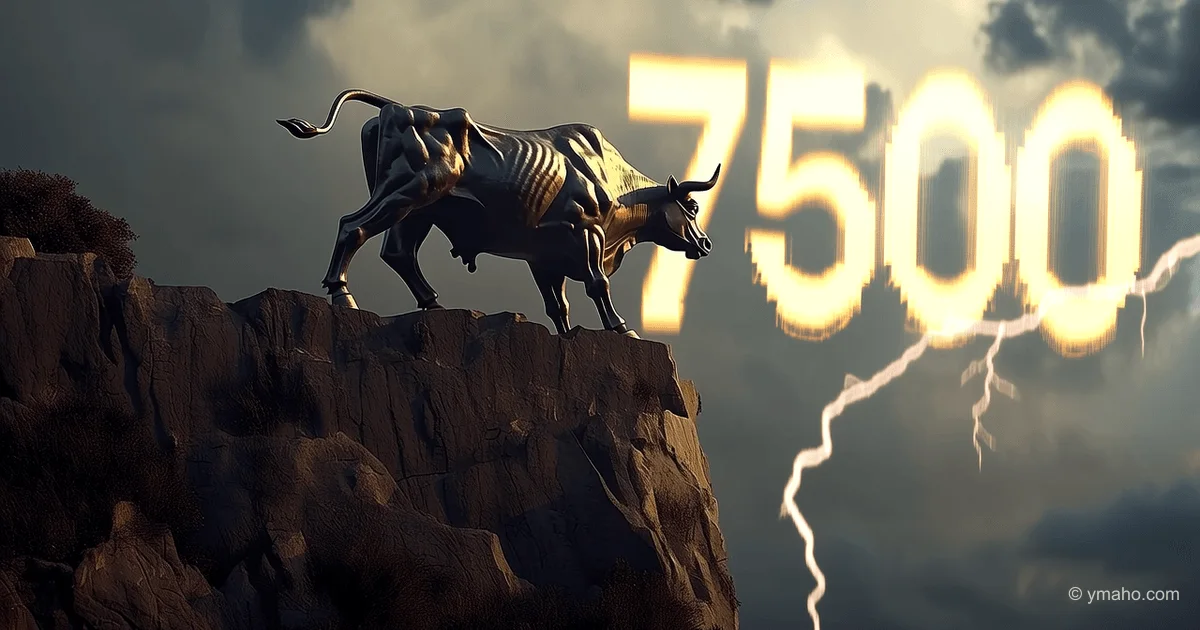
S&P 500 Closes Above 7,500 for the First Time in History
After trading on May 14, the US indices S&P 500 and Nasdaq Composite hit record highs. The S&P 500 rose 0.29% and closed above the psychological 7,500 mark for the first time, while the Dow Jones gained 0.75%.
The '7,500 Paradox': Why the S&P 500's All-Time High Is a Ticking Time Bomb, Not a Bullish Celebration
What's Really Happening
On the surface, it looks like a triumph: the S&P 500 closed above 7,500. A sweet victory for those betting on a soft landing and an AI boom. But behind the shiny number lies an anomaly that should scare, not delight. We're not witnessing a healthy bull market, but a mechanical melt-up—a forced rally driven not by fundamental faith in the economy, but by dealer hedging and FOMO among large funds. The market reached 7,500 despite the macroeconomy, not because of it. This is a junkie market hooked on option gamma and a narrow group of AI assets.
Timeline and Context: How We Got Here
The trajectory of this rally is unnatural. From the lows of late March, the S&P 500 has gained over 16%, adding $9.4 trillion in market cap. But look at the structure: the entire rally rests on the narrow shoulders of the Magnificent Seven. The median stock in the index is actually in the red and sits 13% below its 52-week high.
The backdrop wasn't Fed rate cuts or easing inflation. On the contrary, the market ignored shocking inflation data and hawkish notes from new Fed Chair Kevin Warsh. The 30-year Treasury yield surged to levels last seen before the 2007 financial crisis. Normally, that kills growth stocks. But this time, a different mechanism kicked in: liquidity injections via zero-days-to-expiry (0DTE) options and dealer gamma.
The key trigger for the latest leg up was geopolitical: approval to sell Nvidia H200 chips to China amid a temporary thaw in US-China relations at a tech summit. That sent Nvidia's market cap to $5.9 trillion, single-handedly dragging the index past the psychological 7,500 mark.
Winners and Losers
Winners: algorithms and volatility sellers. The real winners today are not old-school traders or mutual fund managers. They are market makers (Citadel, Susquehanna) and those selling options. In a positive gamma environment, dealers are forced to buy on dips and sell on rallies, locking the market in a narrow range and creating a smooth, seemingly unbreakable uptrend. Hedge funds that bet against the market (short bias) are crushed. Their high-beta shorts are being squeezed: the high-beta vs. low-beta factor has soared 26.1% since March 30, leaving market-neutral funds with massive losses.
Losers: the broad economy and future stability. The biggest losers are investors who look at the index and think everything is fine. When index gains are driven by just 7 stocks, and the Dow Jones stalls and fails to confirm the record (while the S&P stormed 7,500, the Dow fell 0.53% the day before), that's a classic divergence signaling trouble ahead. Also losing: any fundamental analyst. The correlation between bond yields and stocks is broken. The market has temporarily stopped pricing risk correctly.
What the Media Isn't Telling You: The $187 Billion Time Bomb
Mainstream media report the records. They don't report the structural bomb that algorithms themselves have planted.
Here's the inside scoop most are missing: we are on the verge of the largest forced deleveraging in history, and the scale of the crash has already been mathematically calculated.
Charlie McElligott from Nomura has built a model showing that if the S&P 500 falls just 5% in a single session (a routine correction event), it will trigger a chain reaction. Options dealers, leveraged ETFs, and volatility control funds will be forced to simultaneously sell $187 billion worth of assets. This is no joke or scare story. It's the mechanical physics of a market where 0DTE options have created a doom loop.
In the past, when the market fell, value investors stepped in. Now, due to negative gamma, any decline will be accelerated by market maker selling. The ladder we climbed up will vanish, and we'll fall into the abyss. This mechanism is described as a 'jump off a high cliff.'
Also overlooked is the role of JP Morgan's collar. Every quarter, this giant hedge fund rolls over protective put options. While they are active, dealers hedge, supporting the market. But after options expiration, the support vanishes. We saw this in April after the March roll—one of the worst months since COVID. We are now entering the May OPEX window, and gamma support could evaporate like smoke.
Forecast: Next 30 Days and 90 Days
Next 30 Days (through mid-June 2026):
Expect calm before the storm. Technically, the market could make another push higher—to 7,600 or even 7,700 on the S&P, if Nvidia's May 20 earnings beat expectations and trigger a new wave of FOMO. Morgan Stanley is already fanning the flames, calling for 8,000.
But once options expiration passes, expect a sharp removal of the gamma anesthesia. As early as the week after OPEX, the market will become dangerously free. Consolidation in the 7,400–7,500 range will quickly end. If summer seasonality kicks in, a slide toward 7,200 will begin.
Next 90 Days (through mid-August 2026):
This is the zone of maximum turbulence. 'Summer is traditionally a weak period for the S&P 500.' The combination of shrinking market breadth, extreme concentration, and low liquidity will create a perfect storm.
I expect the S&P 500 to visit the 7,000–7,100 level (200-day moving average). The evil twin of the rally will kick in: the selling mechanism that Nomura estimates at $187 billion. A 5% one-day drop from current levels is a technical inevitability in a negative gamma environment, not a theory. That would send semiconductor ETFs (SMH) into a tailspin.
The only thing that could temporarily delay the verdict is continued dovish rhetoric on China and massive AI chip buying. But when Nvidia stops surprising, the market will remember that Treasury yields are at highs and the Fed is in no hurry to cut rates. A market that climbed Everest without oxygen risks pulmonary edema.
Bottom line: Closing above 7,500 is not a buy signal. It's a signal to check stop-losses and buy protection. This is a market that delivered a decade's worth of returns in six months and is structurally ripe for a correction that will surprise even the bears with its speed.
— Editorial Team