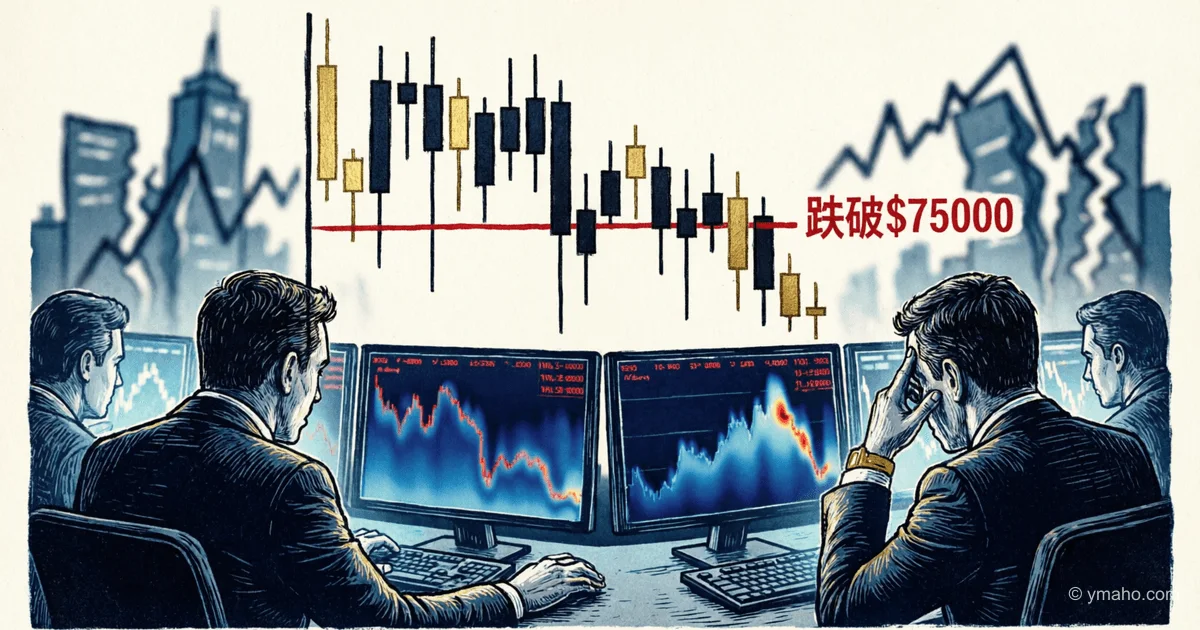
Bitcoin Plunges Below $75,000, Triggering Nearly $1 Billion in Liquidations
On May 24, Bitcoin's price broke through the psychological mark of $75,000, triggering massive forced position closures on the crypto market totaling about $1 billion. Against this backdrop, analyst Mark Connors expressed the view that Bitcoin could outperform traditional assets in the new cycle.
$75,000 as a Mirror: Why $1 Billion in Liquidations Is Not a Crash, but the Start of a New Game
Opinion of an independent analyst, May 25, 2026
On May 24, Bitcoin broke through the psychological mark of $75,000, triggering liquidations totaling nearly $1 billion, of which about $834 million were long positions. This was followed by headlines about a "crash," panic, and yet another death of crypto. But as an analyst who has been observing liquidity structure and whale activity in the derivatives market for the past two years, I see the opposite: this is not the start of a bearish trend. It is the final stage of flushing out overheated leverage before a new cycle, which Mark Connors mentioned yesterday.
Let's break down the essence, timeline, and key insight you won't find in news feeds.
[Essence]: A Hunt for Liquidity, Not Seller Panic
What actually happened? The price crashed to $74,933, but note the structure of liquidations: $834 million out of $923 million were longs. The market was overbought and overleveraged. The ratio of long to short positions reached a critical imbalance. Institutions and market makers simply "collected liquidity" below the $75,000 level, where the maximum number of stop-losses and margin positions had accumulated.
Non-obvious insight:
The very fact of breaking $75,000 was artificially triggered by three multidirectional factors:
- Whale cash-out: 5 days before the crash, 9,664 BTC (about $744 million) were sent to exchanges. Among them was a wallet from Trump Media Group, which sent $200 million worth of BTC for sale. This created excess supply.
- Fed rhetoric: The swearing-in of Kevin Warsh on May 24 raised fears of QT (quantitative tightening), squeezing speculators out of risk assets.
- Leverage trap: As soon as the price fell to $75,000, cascading liquidations kicked in, pushing the price to $74,900. But the bottom was bought up instantly — the buying volume at the $74,200-74,500 level was enormous.
Timeline and Context: Iran, Trump, and the "Dead" Zone
48 hours before the crash, on May 22, Bitcoin was trading peacefully above $82,000. The key trigger was an escalation in rhetoric around Iran. On May 23, Trump announced a "nearly agreed" peace plan, which pushed BTC to $77,000. But within hours, Iranian media refuted the status of the Strait of Hormuz.
The market entered a turbulence zone between two geopolitical outcomes. Traders shorted the bounce, expecting a strike on Iran. But when no strike came, and Warsh signaled a soft line on rates (contrary to expectations), short positions above $77,000 began to close. On May 24, we saw a "double liquidation": first, longs were killed below $75k, then, during an attempted recovery, shorts.
Who Wins and Who Loses
Outsiders (losers):
- Retail traders with 10x-25x leverage. They lost everything within an hour. The largest single liquidation hit a position on OKX worth about $12 million.
- Ethereum bulls. Amid BTC's fall, ETH liquidations totaled $255 million. Bets that ETH would break $2,000 are now priced with a 71.2% probability "FOR" (meaning most expect further decline in ether).
Beneficiaries (winners):
- Market makers and liquidity harvesting strategists. They profited from volatility and spreads.
- A large player (whale) who transferred 308 million USDT on May 24. This is a transfer of stablecoins to exchanges. Typically, $308 million USDT doesn't move without reason — it's preparation to buy a dipped asset. This whale bought the bottom.
What the Media Isn't Saying
The media shouts about $1 billion in liquidations but omits that Bitcoin's Open Interest decreased by only 15-18% after the liquidations. This means "smart money" didn't leave the market; they just shifted from longs to shorts or moved into stablecoins waiting for an entry point.
Moreover, spot Bitcoin ETFs recorded $2 billion in outflows two weeks before the event. This means the drop was provoked by institutions that exited paper positions to re-enter lower. A classic "sell the rumor, buy the panic" strategy.
Interesting is the position of Mark Cuban, who said he "sold most of his BTC after the Iran war." But Cuban is known as a market manipulator. Often his statements about selling are an attempt to create a bottom for his funds to enter.
Forecast: Next 30 Days and 90 Days
30 days (June 2026):
Expect consolidation in the range of $74,000 — $79,000. Key resistance level is $78,100. To start a recovery, bulls need to close a weekly candle above $78,258. If BTC breaks $74,400, a retest of $72,000 and even $69,500 (February 2026 level) is inevitable. However, given the transfer of $308 million USDT to exchanges, I expect a bounce to $79,000 by mid-June. The probability of a Fed rate hike is ruled out, which will support risk assets.
90 days (August 2026):
The "altcoin season" will not occur. Bitcoin dominance (BTC.D) will rise from the current 54% to 58-60%. Those who suffered in the liquidations will no longer take risks on alts. They will return to crypto "blue chips." I expect BTC to trade in the range of $82,000 — $88,000, but a breakout above $90,000 will be capped by low liquidity due to the summer season. The target of $150,000 by year-end (9.5% probability according to XBIT DEX) currently looks like fantasy, but by autumn, history may repeat.
Editorial Forecast
Asset: Bitcoin (BTC/USD)
Direction: Sideways with increased volatility in the next 24-48 hours, then up to the $78,500 zone by the end of 72 hours.
Key Levels: Support — $74,400 (critical level, loss leads to $72,000). Resistance — $77,000.
Confidence: Medium (55%) — the market is hostage to Iran news.
Main Risk: Escalation of the Middle East conflict (strike on Iran) would instantly crash BTC back to $71,000-$72,000, nullifying the entire effect of the liquidations. Watch news feeds on Sunday evening.
This is the editorial opinion and is not investment advice.
— Editorial Team