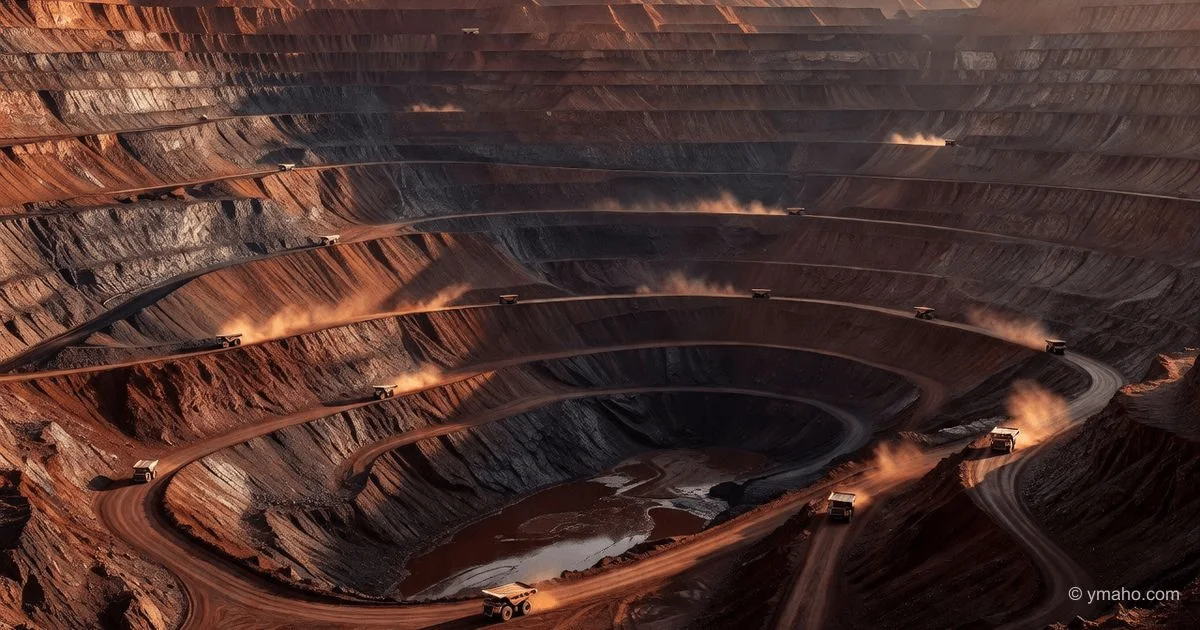
Understanding Commodity Cycles: Patterns That Drive Markets
Commodity cycles are the rhythmic expansions and contractions in the prices of raw materials like oil, wheat, copper, and gold, driven by the fundamental tension between supply, demand, and the time it takes to bring new production online. Understanding these patterns is crucial because they underpin global inflation, influence central bank policy, and directly impact the cost of everything from a loaf of bread to a new car. This article explores how do commodity cycles work and what drives them, providing a framework to decipher the seemingly chaotic movements in these essential markets.
What You'll Learn
By the end of this explainer, you'll understand the core mechanisms that drive commodity prices up and down over time, from supply shocks to financial speculation. You'll be able to identify the key phases of a typical cycle and differentiate between cyclical and secular trends. Most importantly, you'll walk away with a practical framework for interpreting commodity price movements and their potential impact on your personal finances and investment decisions.
How It Works: The Mechanics of a Commodity Cycle
At its heart, a commodity cycle is a story of mismatch between supply and demand. Unlike manufactured goods, commodity supply is often fixed in the short term because it depends on natural processes (growing seasons) and massive, long-term capital projects (mines, oil rigs, farms). This characteristic is known as inelastic supply, and it is the primary engine of price volatility.
The Classical Cycle: A Step-by-Step Mechanism
Think of the classic commodity cycle as a five-act play:
The Boom (Price Rise): Strong economic growth, often led by a rapidly industrializing nation (like China in the 2000s), creates a surge in demand for raw materials. Supply cannot adjust quickly, leading to shortages and a sharp increase in prices. This phase is characterized by high profitability for producers.
The Investment (Supply Response): High prices signal a massive opportunity. Mining companies approve new projects, farmers plant more acreage, and oil companies invest in expensive exploration and drilling. This stage takes significant time—sometimes five to ten years for a new mine to go from discovery to production.
Google AdInline article slotThe Glut (Price Peak and Overcorrection): As these massive investments simultaneously come online, supply suddenly overshoots demand. A surplus, or glut, develops. Storage facilities fill up, and producers are forced to compete on price, leading to a dramatic crash.
The Bust (Price Crash): Prices fall below the cost of production for many high-cost operators. Weaker firms go bankrupt, capital is cut from exploration and maintenance, and the industry contracts. This is a painful but necessary phase of "creative destruction."
The Stabilization and Rebalance: Low prices eventually stimulate new demand and choke off supply. As the global economy continues to grow, the surplus is gradually absorbed, inventories normalize, and prices stabilize at a new, lower equilibrium, ready for the cycle to begin again.
Google AdInline article slot
This classical pattern is beautifully illustrated by the concept of the "hog cycle," an agricultural economic model that describes price fluctuations in livestock. As the World Bank notes in its commodity market studies, the time lag between price signals and production decisions is a key feature that "creates a cobweb effect, leading to persistent cycles in prices."
The Role of Shocks and the New Paradigm
While the classic cycle is driven by demand, the modern commodity landscape is increasingly defined by extreme supply shocks. According to analysis from the Federal Reserve, these shocks often have a more significant and sudden impact than demand shifts.
Supply Shocks: These are unforeseen events that quickly take supply offline. Examples include the 1973 oil embargo, the Fukushima nuclear disaster, and recent geopolitical tensions. The IMF's 2023 World Economic Outlook highlighted that supply shocks "propagate more rapidly through the global economy than demand shocks."
Financialization: Over the past two decades, commodities have become a mainstream asset class. This has introduced new dynamics, where prices are influenced not just by physical supply and demand but also by index funds, futures traders, and algorithmic trading. As a 2022 paper in the Journal of Commodity Markets concluded, "while fundamentals remain the primary driver, financial flows can amplify price movements, leading to overshoots in both directions."
Why It Matters: The Real-World Impact
Understanding these cycles is not just an academic exercise; it has profound consequences for households, businesses, and nations.
The Inflation Engine: Commodity prices are a leading indicator of inflation. When oil and food prices rise, the cost of transportation and basic goods increases, eroding purchasing power. Central banks, like the U.S. Federal Reserve, monitor commodity indices closely. A consistent rise in these prices often signals the need for a more hawkish monetary policy.
The Producer vs. Consumer Dynamic: A boom is fantastic for producing nations (e.g., Saudi Arabia, Australia, Chile) and their corporate profits. A bust, however, can devastate their economies, leading to recessions and social unrest. Conversely, consumer nations (like China, Japan, and most of Europe) suffer during a boom and benefit during a bust. This dynamic can reshape global geopolitical power.
Investment Strategy: For investors, understanding commodity cycles is essential for portfolio diversification. Commodities often have a low or negative correlation with stocks and bonds. As research from the Bank for International Settlements (BIS) shows, they can act as a powerful hedge against inflation and systemic risk.
By the Numbers: Key Historical Data
The following table illustrates the magnitude and duration of major commodity cycles over the last century.
| Period | Key Commodity | Price Movement (Approx.) | Duration | Primary Driver |
|---|---|---|---|---|
| 1930s | Wheat | ~50% decline | 3-4 years | Great Depression, demand collapse |
| 1970s | Crude Oil | $3 to $35 (peak) | 8-10 years | OPEC Embargo, supply shocks |
| 1980s | Gold | $850 to $250 | 3 years | Aggressive Volcker Fed policy (deflation) |
| 2000-2008 | Broad Index (Oil, Copper) | ~300% increase | 8 years | Chinese industrialization, demand boom |
| 2008-2020 | Broad Index (Oil, Copper) | ~60% decline | ~12 years | Financialization, rise of shale, demand shifts |
| 2020-2022 | Lumber, Oil | ~100%+ increase | 2 years | Pandemic supply chain disruptions, stimulus |
Sources: Data compiled from World Bank Commodity Price Data, Bloomberg Terminal historic prices, and OECD Economic Outlook.
Common Myths vs. Facts
| Myth | Fact |
|---|---|
| Myth: "Commodity prices are just random." | Fact: While volatile, prices follow a recognizable boom-and-bust cycle driven by the inelasticity of supply, a phenomenon documented by the IMF and the Federal Reserve. |
| Myth: "Speculators are the only reason prices go up." | Fact: Speculation can amplify moves, but the primary drivers are real supply and demand fundamentals. As a BIS working paper stated, "Financialization has contributed to price volatility, but it does not override the influence of physical market conditions." |
| Myth: "A new 'supercycle' makes old rules obsolete." | Fact: While structural shifts (like the green energy transition) can create long-term secular trends, the core cyclical mechanisms of over- and under-investment remain powerful forces. |
| Myth: "Commodities are a foolproof inflation hedge." | Fact: While they can be a strong hedge, it's not perfect. In the short run, they can crash along with stocks during a deflationary shock (e.g., 2008), proving correlation can converge to positive in a crisis. |
| Myth: "Low prices are always bad." | Fact: Low prices are bad for producers, but they are a massive benefit to consumers and manufacturing-based economies. They also act as the signal that triggers the next cycle by starving the market of new investment. |
What You Should Do With This Knowledge
So, how can you practically apply this understanding to your life?
For Consumers: Recognize the signs. When you see headlines about supply disruptions, be aware that you may soon feel it at the pump and in grocery bills. Understanding the lag between a price shock and a supply response can help you better plan your household budget for the months ahead.
For Investors: Use it as a tool. Do not simply buy or sell based on today's price. Instead, look at the longer-term cycle. As famed investor and author of The Alchemy of Finance, George Soros, might suggest, scrutinize the trend itself. Are we in a phase of under-investment (signaling a potential boom) or over-investment (signaling a potential bust)? A cyclical approach can help you time entries into commodity-related assets.
For Business Owners: Optimize your supply chain. If you are a manufacturer who depends on raw materials, understanding these cycles is critical for risk management. You can use this knowledge to inform your hedging strategy, locking in prices during busts to protect your margins during booms.
For the Informed Citizen: Contextualize the news. When a politician or pundit blames the other party for high gas prices, your knowledge of the 5-year lag from oil exploration to production will give you a more nuanced and accurate view of the reality.
The goal is not to predict the exact turning point of a cycle—that's impossible—but to understand the powerful forces at play so you can make more informed, strategic decisions and avoid being caught off guard by the market's dramatic swings.
Frequently Asked Questions
1. What exactly are commodity cycles and how long do they typically last? Commodity cycles are the long-term patterns of price increases (booms) and decreases (busts) in raw materials. They typically last between 5 to 15 years from peak to peak, a duration largely determined by the multi-year lag it takes for new supply projects, like mines or oil fields, to come online after a price signal.
2. How do commodity cycles work and what drives them in the modern era? They work through a fundamental mismatch in supply and demand timing. The primary drivers are strong demand growth (often from emerging economies) and significant supply shocks (like wars or pandemics). Today, financial speculation and the green energy transition are increasingly influential secondary drivers that can amplify price movements.
3. How can I use the commodity cycle to make better investment decisions? Instead of chasing hot prices, use the cycle to identify the stage of investment. A bust, characterized by cutbacks in exploration and capital spending, often sets the stage for a future boom. Conversely, a frenzy of new investment in a boom often signals a looming bust. This contrarian approach can help you find value.
4. Is the current high oil price a sign of a new supercycle? While some analysts argue that the transition to green energy is creating a new "supercycle" for critical metals (like copper and lithium), current high oil prices are more likely a result of a classic cycle exacerbated by ongoing geopolitical supply shocks. The distinction is crucial for long-term planning.
5. What is the difference between a commodity cycle and a market cycle? A market cycle (stock market cycle) is driven primarily by investor psychology, corporate earnings, and interest rates, reacting much faster to news. A commodity cycle is driven by physical production and consumption, with a much slower feedback loop due to the time needed to change supply. They are related but distinct economic forces.
Sources
- World Bank. (2023). Commodity Markets Outlook. Washington, D.C.: World Bank Group.
- International Monetary Fund (IMF). (2023). World Economic Outlook: A Rocky Recovery. Chapter 3: The Return of the Supply Shock.
- Federal Reserve Bank of St. Louis. (2021). Understanding the Dynamics of Oil Price Shocks. Economic Synopses.
- Bank for International Settlements (BIS). (2022). Commodity prices and monetary policy. BIS Working Papers.
- Henderson, J., & Pearson, N. D. (2022). "The Financialization of Commodity Markets: A Review." Journal of Commodity Markets, 25, 100220.
- OECD. (2023). OECD Economic Outlook, Volume 2023 Issue 1. Organisation for Economic Co-operation and Development.
— Editorial Team