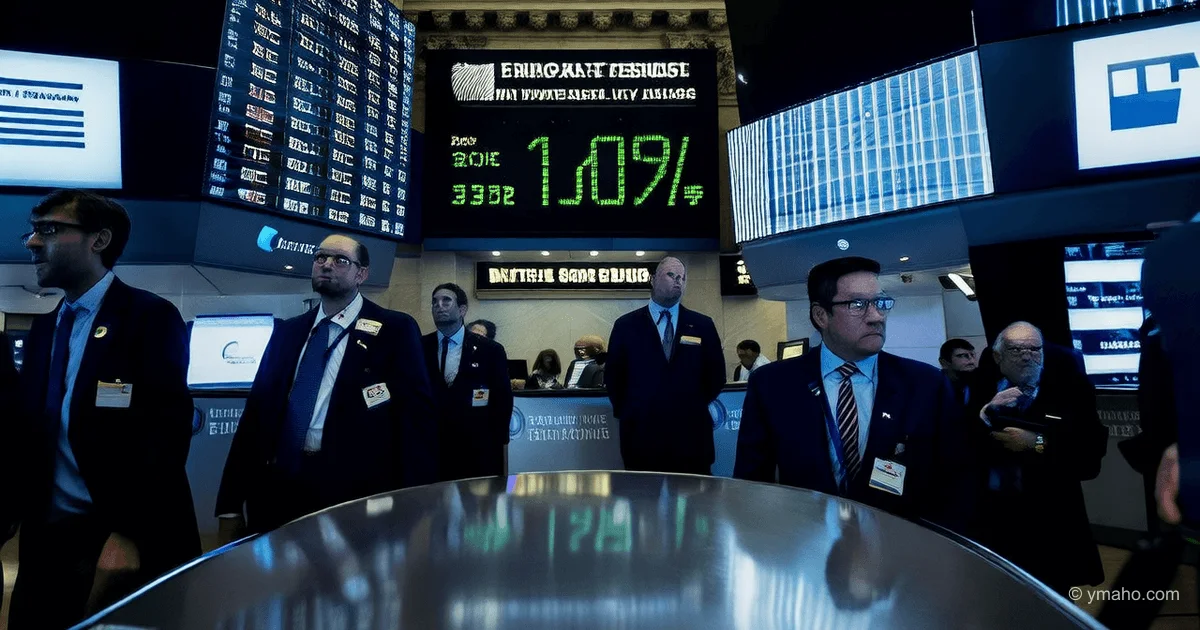
US Stocks Close in Synchronized Decline Despite Record Highs Day Earlier: S&P 500 Falls 1.24%
Despite strong industrial production data, major US indices plunged: the S&P 500 fell to 7,408 points, the Nasdaq 100 collapsed 1.57%, as risks of accelerating inflation and Fed rate hikes outweighed growth euphoria.
This is not just a correction. It is the moment the market finally admitted: the era of cheap money is over, and the Fed under Kevin Warsh will now act in the exact opposite direction of what was expected for the past year and a half.
The Gist: What's Really Happening
The S&P 500 fell 1.24% to 7,408 points, the Nasdaq plunged 1.54%, and the Dow Jones lost over 537 points. But the index numbers are just the tip of the iceberg. Beneath the surface lies a tectonic shift in market expectations for the Fed rate. CME FedWatch now shows a 51% probability of a rate hike as early as December 2026, and by March 2027, that probability exceeds 71%.
This is not a reaction to bad news. It is a reaction to too-good news. Industrial production rose 0.7% against a 0.2% forecast. April PPI showed a 6.0% increase — the highest since 2022. Consumer inflation CPI hit 3.8%, exceeding all forecasts. In normal times, a strong economy is a reason for a rally. But now, every positive data point brings a rate hike closer, making stocks less attractive compared to bonds.
The yield on 30-year Treasuries broke above 5.1%. This is a level the market hasn't seen since 2007. And when a "risk-free" instrument offers such yield, even the most steadfast investors start fleeing risky assets.
Timeline and Context
The chain of events unfolded with surgical precision. May 8 — CPI at 3.8%, the market is nervous but holds. May 12 — The Senate confirms Kevin Warsh as Fed chair by a 54-45 vote, the narrowest in modern history. May 14 — PPI at 6.0%, the market begins pricing in a rate hike. May 15 — The Trump-Xi summit in Beijing ends without breakthroughs on the Iran situation. Brent crude surges above $109, and Trump says his patience with Iran is "running out." And that evening — a synchronized collapse of all three major indices.
The key point most commentators miss: this decline did not happen on negative data. It happened against the backdrop of record highs the day before. The S&P 500 hit an all-time high near 7,430 points — and then crashed from it. This is a classic "buy the rumor, sell the fact" pattern, where the "fact" was the realization that Warsh will lead the Fed in a completely different direction than the market expected.
Who Wins and Who Loses
The biggest losers are obvious — the tech sector. Intel plunged over 6%, AMD lost 5.7%, Micron 6.6%, Nvidia 4.4%. Cerebras Systems, which had soared 68% on its IPO the day before, retreated 10%. The tech sector's total losses for a single session amount to hundreds of billions of dollars in market capitalization.
But the real tragedy is unfolding in the small-cap segment. The Russell 2000 fell 2.4% — nearly twice as much as the S&P 500. This means the sell-off hit not just overheated AI assets, but the entire market. Investors are fleeing risk across the board.
The energy sector wins. In the same week the S&P 500 treaded water, the energy sector rose 6.05%. SolarEdge surged 49.6% for the week, Enphase Energy 45.1%. Solar energy producers are direct beneficiaries of the Persian Gulf conflict: the more expensive oil is, the more attractive alternative energy becomes.
Holders of short-term Treasuries and money market funds win. Yields on 2-year notes rose to 4.06%, on 10-year notes to 4.55%. This means the carry trade of "borrow cheap, invest in risky assets" becomes unprofitable. Money flows from stocks to bonds, and those who shifted early are now locking in decent returns with minimal risk.
Mortgage borrowers and the real estate market lose. The real estate sector fell 2.89% for the week — a leading indicator of problems in the housing market, which is extremely sensitive to rates.
What the Media Isn't Saying
The first non-obvious insight concerns the true scale of the problem. CME FedWatch shows a 51% probability of a rate hike in December. But that's just the tip of the iceberg. Over-the-counter forward contracts, traded by major dealers, price in a probability of 58-62%. CME shows a lower figure because market makers have removed quotes on far-dated strikes — no one wants a repeat of March 2025, when a Chicago prop trading fund lost $340 million in a single session on a sharp rate move.
The second point concerns Kevin Warsh. The Senate confirmed him by a margin of just 9 votes — the narrowest result for a Fed chair in modern history. But what really matters: Warsh is the first chair in history to personally hold crypto assets. At the same time, he is one of the most hawkish officials since the financial crisis. His concept of "QT-for-Cuts" — simultaneously cutting rates and shrinking the Fed's balance sheet by selling mortgage-backed securities — could radically reshape the liquidity market.
Trump publicly demanded that Warsh "immediately cut rates" and jokingly threatened to "sue him." But the market no longer believes in political pressure on the Fed. Traders price in a 39% probability of a rate hike, and Polymarket gives 97% odds that the June meeting will leave rates unchanged. This means that even a "hand-picked" Fed chair cannot ignore macroeconomic reality.
The third insight is geopolitical. The Trump-Xi summit, on which the market had pinned huge hopes, ended in nothing. The sides agreed that the Strait of Hormuz "must remain open," but no concrete de-escalation plan emerged. Moreover, according to Interactive Brokers, Trump refused to ask Xi for help on the Iran issue. This means the energy crisis will drag on, and oil will remain a structural inflation factor for months.
Forecast: Next 30 and 90 Days
Next 30 days (by June 16). The first FOMC meeting under Warsh's chairmanship will be on June 16-17. I expect rates to remain unchanged, but the rhetoric will be extremely hawkish. The 10-year Treasury yield could rise to 4.75-4.80%. The S&P 500 will test the 7,200 level — another 3% drop from current levels. The tech sector will continue its correction, as rising yields make their sky-high multiples unjustifiable.
The key moment in June is the updated dot plot (rate projections from FOMC members). If the median projection shifts toward a rate hike, it will signal a full-blown sell-off, potentially pushing the S&P 500 to 7,000 points.
Next 90 days (by August 16). Here we have a three-scenario fork. Base case (55% probability): Warsh keeps rates at 3.50-3.75% until September, but hawkish rhetoric and the ongoing Persian Gulf conflict keep oil above $100. Inflation remains high, and the S&P 500 consolidates in the 7,000-7,300 range. This is a "slow grind" scenario — no panic, but no growth.
Negative scenario (30%): The Fed hikes 25 basis points as early as June or July. This would trigger a shock reaction — the S&P 500 could fall to 6,800, and the Nasdaq would lose another 10-12% from current levels. The mortgage market would virtually freeze. Small-cap stocks would continue to plunge, as small companies are most sensitive to borrowing costs.
Catastrophic scenario (15%): A full blockade of the Strait of Hormuz and escalation of the US-Iran conflict push oil to $130 and PPI above 8%. The Fed is forced to hike aggressively — by 50 basis points. In this case, a recession in Q4 becomes almost inevitable.
The truth no one on Wall Street wants to say out loud is that the market has entered a new era. An era where inflation is structurally higher, rates are structurally higher, and tech company multiples must structurally decline. The May 15 drop is not a one-off correction but the beginning of a long process of risk repricing. Those who keep buying the dip, as in 2020-2024, risk facing a reality where the "dip" turns into a new bear trend.
— Editorial Team