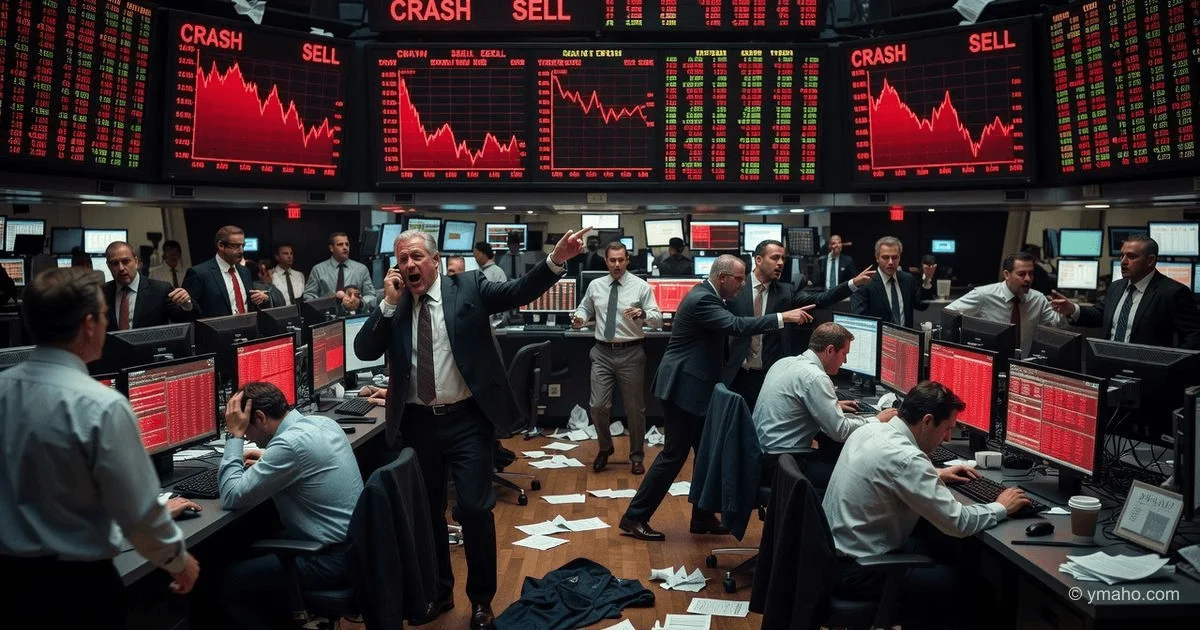
Spotting a Bubble: 7 Characteristics of Manias and Crashes
From the Dutch Tulip Mania of the 1630s to the 2008 housing crisis and recent cryptocurrency volatility, financial markets have repeatedly experienced the same destructive cycle. Understanding what are the common characteristics of market bubbles is the single most important step an investor can take to preserve capital and avoid the psychological traps that lead to catastrophic losses. This guide distills decades of financial history and behavioral economic research into seven definitive traits that define every major mania and crash.
What You'll Learn
Market bubbles are driven by a predictable pattern of widespread asset speculation, new narrative justifications, and the eventual collapse of credit expansion. The defining characteristic is a sustainable deviation of asset prices from their intrinsic value, exacerbated by leverage and a "greater fool" mentality. Recognizing these seven traits allows investors to detach from herd mentality and implement protective strategies before the downturn.
1. The Paradigm Shift: A "New Era" Narrative
Every major bubble is accompanied by an irresistible story—a belief that traditional valuation metrics have become obsolete. This narrative claims that structural changes in the economy, whether technological, political, or demographic, have rendered historical precedents irrelevant. During the late 1990s dot-com bubble, the narrative was the "New Economy," where internet companies were expected to grow exponentially, justifying massive losses. In the 2000s housing bubble, the "New Era" narrative posited that home prices would rise indefinitely because land was finite and financial innovation (mortgage-backed securities) had spread risk effectively.
This narrative is often formally articulated by central bankers, prominent economists, and financial media. For instance, in a 1996 speech, then-Federal Reserve Chairman Alan Greenspan famously questioned whether "irrational exuberance" was driving markets, but the subsequent policy environment often failed to curb the enthusiasm that followed. In 2005, Greenspan acknowledged the presence of "froth" in housing markets but maintained that a "nationally financed bubble" was unlikely. A 2008 Federal Reserve Bank of San Francisco working paper later confirmed that such "new era" thinking has historically been a consistent precursor to asset price collapses. Based on this historical pattern and the Fed's own retrospective analysis, a reasonable conclusion is that when the market consensus shifts toward "this time is different," it is a robust warning signal.
2. Broadening Participation: The "Greater Fool" Theory
As a bubble expands, the initial cohort of sophisticated institutional investors gives way to a broader, less experienced public. This phase is marked by a significant increase in retail trading volume and the emergence of new, often inexperienced, market participants. The psychology shifts from investing based on fundamentals to speculating on resale value—the belief that one can sell the asset to a "greater fool" at a higher price.
Academic research from the National Bureau of Economic Research (NBER) has quantified this phenomenon. A 2011 study by Greenwood and Nagel found that young, inexperienced mutual fund managers were the most aggressive buyers during the tech bubble's peak, exhibiting the highest levels of overconfidence. Furthermore, data from the Federal Reserve's Survey of Consumer Finances shows that direct and indirect stock holdings among U.S. households rose from 32% in 1989 to over 50% in 2000, corresponding with the peak of the dot-com crisis. This trend repeated in 2021, when retail trading platforms like Robinhood saw a massive influx of users, and the Bank for International Settlements (BIS) noted a sharp increase in household leverage and equity purchases by first-time traders.
3. Valuation Decoupling: Price Disconnect from Fundamentals
This is the most quantifiable characteristic. In a bubble, asset prices rise to levels that cannot be justified by any reasonable discounted cash flow model or historical earnings multiple. The price-to-earnings (P/E) ratio of the S&P 500 reached approximately 44 in 1999, more than double its historical average of around 15. During the housing bubble, home price-to-income ratios and price-to-rent ratios exceeded their long-term trends by margins that were statistically unprecedented in post-war U.S. data, according to the Federal Housing Finance Agency (FHFA).
When the market is in a mania, investors begin to ignore these metrics. Instead, they focus on alternative, often nonsensical, "metrics" such as "eyeballs," "page views," or "Bitcoin hash rate." A 2018 paper in the Journal of Financial Economics demonstrated that during the cryptocurrency boom, the correlation between Bitcoin's price and its underlying utility (transaction volume and cost) was virtually zero. This decoupling represents a fundamental breakdown of price discovery. The IMF, in its October 2022 Global Financial Stability Report, explicitly warned that the decoupling of asset prices from fundamentals in private markets was a systemic risk.
4. Massive Leverage: The Fuel for the Fire
Credit expansion is the accelerant that turns a bull market into a bubble. When investors can borrow money cheaply to purchase assets, it amplifies both gains and losses. As prices rise, the collateral value increases, allowing for more borrowing, which in turn buys more assets, creating a feedback loop of self-reinforcing euphoria.
Data from the OECD and the BIS consistently show that rapid private sector credit growth precedes systemic banking crises. The pre-2008 period saw the creation of complex financial instruments (e.g., Collateralized Debt Obligations) that allowed financial institutions to leverage their housing exposure up to 30-to-1 or higher. Similarly, margin debt—money borrowed to buy stocks—hit record highs in the U.S. in 2021, coinciding with the meme-stock phenomenon. > ⚠️ Critical Warning: Leverage transforms a market correction into a crash. When prices fall, margin calls force forced selling, which drives prices down further, triggering a cascading liquidation cycle. As the Bank of England noted in its 2023 Financial Stability Review, high levels of non-bank financial institution leverage are a primary concern for systemic stability in modern markets.
5. Rising Fraud and Malfeasance
Manias create an environment where due diligence is abandoned and greed overrides ethics. A significant increase in fraudulent activity is a hallmark of the late stages of a bubble. The SEC often reports a surge in enforcement actions following market peaks, as the accounting manipulations and Ponzi schemes that flourished during the boom are exposed during the bust.
The most infamous example is the 2008 crisis, which involved systemic mortgage fraud, predatory lending, and the packaging of "NINJA" loans (No Income, No Job, or Assets) into securities that were fraudulently represented as safe. Enron and WorldCom were exposed during the dot-com crash. More recently, the collapse of FTX in 2022—revealed as a massive fraud—corresponded with the cyclical peak of cryptocurrency enthusiasm. According to the Association of Certified Fraud Examiners (ACFE), fraud schemes are consistently more likely to be uncovered during economic downturns because the rising tide of a bubble hides the cracks in financial statements.
6. Extreme Volatility and Price "Blow-Offs"
The terminal phase of a bubble is rarely a slow decline. It is characterized by erratic, extreme price movements. This occurs as the consensus fractures; some investors begin to sell while others, believing the dip is a buying opportunity, rush to purchase. This tension results in massive intraday swings and "blow-off tops"—a final, explosive surge in price that quickly reverses.
Research by Didier Sornette, a professor at ETH Zurich, identifies "log-periodic oscillations" as a mathematical signature of these patterns. His analysis of the 1929, 1987, and 2008 crashes shows that prices exhibit increasing oscillations and volatility as they approach the critical tipping point. This is a rational outcome of a market where sentiment is dominating: the information cascade breaks down, and the herd begins to scatter. The VIX (Volatility Index), often referred to as the "fear gauge," spikes dramatically during these periods, serving as a real-time barometer of market distress.
7. The Catalyst: The "Minsky Moment"
The final characteristic is the catalyst—the event that pricks the bubble. Often, this catalyst seems relatively minor in hindsight (e.g., a hedge fund default, a small interest rate hike, a regulatory change). However, in a highly leveraged and overvalued market, a small shock is sufficient to collapse the entire structure. This is known as a "Minsky Moment," named after economist Hyman Minsky, who argued that stability breeds instability by encouraging excessive risk-taking.
For example, the 2000 crash was partially triggered by the failure of a $1 billion fiber-optic network, which signaled that the telecommunications boom was over. In 2008, it was the bankruptcy of Lehman Brothers, triggered by a relatively modest decline in housing prices. Based on the BIS's analysis of past crises, and the Federal Reserve's historical data on asset correlations, a reasonable conclusion is that the catalyst is often unpredictable, but the systemic fragility created by the previous six characteristics guarantees that some catalyst will inevitably appear.
Frequently Asked Questions
When is the best time to sell during a bubble?
The safest approach is to rebalance your portfolio according to a strict asset allocation strategy before the peak. Attempting to time the exact top is virtually impossible. Aim to sell gradually as valuations enter historically overvalued territory, taking profits systematically.
Can a bubble last for years, or does it crash quickly?
The duration can vary significantly. The Japanese asset price bubble inflated for five years before crashing in 1991. However, the final blow-off phase—the rapid price collapse—often occurs within months or weeks. The expansion is gradual; the contraction is swift and violent.
Are all asset classes affected equally during a crash?
No. Crashes tend to affect risk assets like stocks, high-yield bonds, and real estate the most. Government bonds and cash equivalents like U.S. Treasuries often appreciate in value as investors seek safe havens. Gold can either rise or fall depending on liquidity constraints.
Is it possible to profit from a bubble or market crash?
Yes, short-selling or put options can profit from a decline, but these strategies carry unlimited risk and are not recommended for average investors. More prudently, maintaining cash reserves allows you to buy undervalued assets during the crash, a strategy famously outlined by Warren Buffett's "be greedy when others are fearful."
How reliable are historical patterns in predicting future bubbles?
While history does not repeat exactly, it often rhymes. The underlying psychology and financial mechanics (leverage, new narratives, valuation decoupling) remain remarkably constant. Therefore, understanding what are the common characteristics of market bubbles provides an indispensable framework, even if it cannot predict the exact timing of the next event.
— Editorial Team