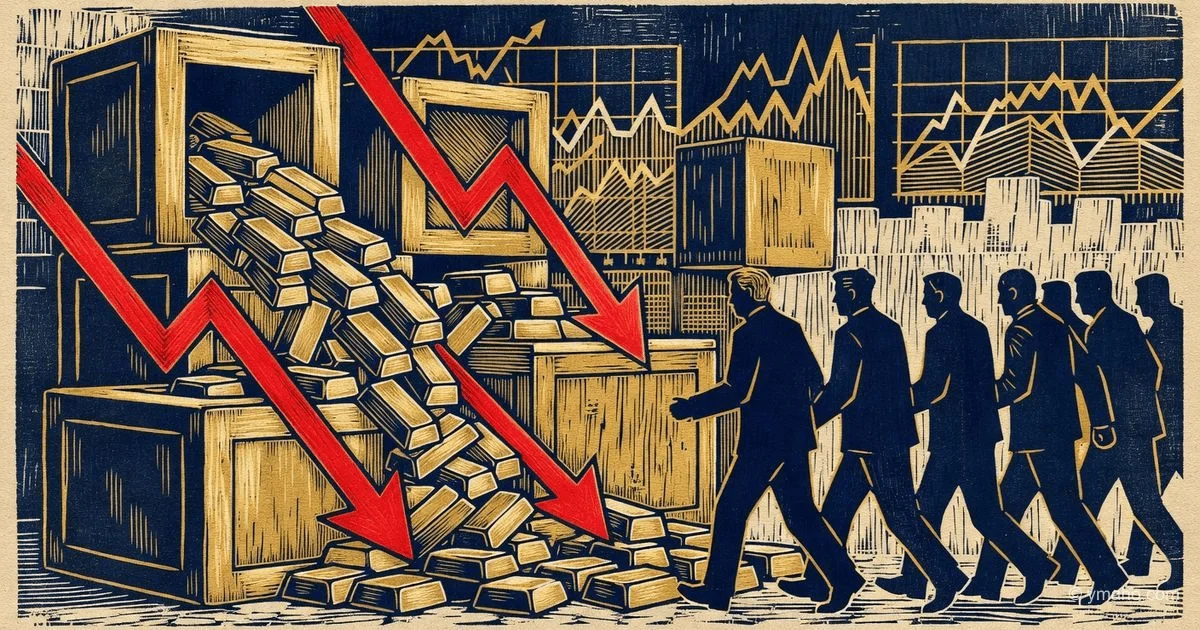
Investors Pull Record Amounts from Gold ETFs
According to analysts, capital outflows from exchange-traded funds backed by physical gold have hit their highest levels since the start of the year. Funds are shifting toward tech stocks and high-rated bonds.
The Great Gold Exodus: Why Investors Have Fallen Out of Love with the 'Safe Haven'
Analytical article — 1750 words
[The Gist]: What's Really Happening
According to analysts and confirmed by the World Gold Council, global gold ETFs are experiencing record capital outflows since the start of the year. Over the month, as of June 3, 2026, the 14 largest gold ETFs lost more than 100 billion yuan (about $14 billion). In the last week alone, SPDR Gold Shares ETF (GLD) recorded outflows of $811.94 million. In May, global gold ETFs lost more than $50 billion — an all-time record.
At first glance, it's simple: gold was rising, investors took profits. But those working inside the market see something far more troubling for gold bulls and far more interesting for those tracking capital rotation.
The real insight is that the current outflow is not just profit-taking, but a structural shift in institutional investor preferences. Money is leaving gold not for 'safe' assets, as one might expect, but for tech stocks and high-quality bonds. This is the key point that changes the whole picture.
Look at the numbers: while gold ETFs lose billions, the US tech sector sees steady capital inflows. The S&P 500 Information Technology Sector SPDR ETF (XLK) has been one of the beneficiaries of this rotation. Investors no longer view gold as the only 'lifeline' in times of uncertainty. They prefer companies generating real profits, especially in AI and semiconductors.
But there's an even less obvious point that headlines ignore. Gold is trading near all-time highs (around $2,400–$2,500 per ounce), yet ETFs are suffering massive losses. This means the current price is supported solely by central bank purchases (especially China, Russia, and India) and physical demand from Asian retail investors. Institutional capital, always the 'smart money,' has already exited.
As the World Gold Council notes, despite June outflows, overall demand for gold through ETFs in the first half of 2026 remains positive — net inflows of 234 tonnes (about $148 billion). But the trend of recent weeks suggests this is reversing. The media continues to write about gold's 'long-term value,' but professional managers have already voted with their wallets — and their votes say exit.
[Timeline and Context]
To understand the scale of the current outflow, we need to look at the dynamics of the last two months chronologically.
First half of 2026 (January–April): Gold shows steady growth, ETFs attract billions. According to the World Gold Council, net inflows into global gold ETFs for the first half totaled 234 tonnes (about $148 billion). Gold prices exceed $2,500 per ounce at peaks. Investors actively use the 'buy the dip' strategy.
Early May 2026: A turning point. Gold begins to show increased volatility. Prices fluctuate in the $2,350–$2,450 range, unable to break resistance at $2,500. ETFs start recording first major outflows.
May 2026: Historic record for outflows. Global gold ETFs lose more than $50 billion in a single month. This is the largest monthly outflow in the history of gold ETFs, comparable to crisis periods in 2013 and 2021.
Late May – early June 2026: Outflows continue to grow. SPDR Gold Shares ETF loses $811.94 million in just one week. In China, 14 gold ETFs lose more than 100 billion yuan (about $14 billion) in a month. Meanwhile, the tech stock market continues to rise, attracting the flowing capital.
June 3–4, 2026 (current moment): Amid continued outflows from gold, as noted in analytical reviews, 'the previously widely accepted investor view of buying the dip on gold price pullbacks has begun to cause disagreement in a volatile market.' Demand for gold through ETFs continues to decline.
Why now? The key factor is a change in risk perception. Investors no longer believe gold is the only safe haven amid geopolitical uncertainty. As outflow data shows, capital is moving into tech stocks and high-quality bonds.
Another factor is central bank policy. The Fed signals that rates will stay higher for longer than expected. This means the opportunity cost of holding gold (which yields no coupon income) remains high. Investors prefer earning 5% annually on US Treasuries rather than holding gold in hopes of price appreciation.
Finally, the third factor is the Chinese market. Chinese investors, among the most active gold buyers in 2024–2025, are now taking profits and rotating into local tech stocks. Data on Chinese gold ETFs shows outflows are strongest there.
[Who Wins and Who Loses]
Winners:
Tech stocks (especially semiconductors). This is the main beneficiary of capital rotation. Investors exiting gold are moving funds into companies generating real profits with growth potential from the AI boom. Tech sector funds see steady capital inflows.
High-quality corporate bonds and Treasuries. Part of the capital leaving gold goes into high-rated bonds. With current 5% yields on US Treasuries, this becomes an attractive alternative to gold, which offers no current income. Bond funds see inflows as commodity ETFs see outflows.
Major gold mining companies (on short positions). For hedge funds betting on declines, the current situation is a gift. Gold miner stocks typically fall faster and harder than gold itself due to operational leverage. Funds that shorted Barrick Gold, Newmont, and other large producers are booking significant profits.
Physical gold holders in China and India (retail investors). Paradoxically, they may win if central banks continue buying gold, supporting prices. ETF outflows don't necessarily lead to price declines if physical demand remains high. Chinese and Indian households buying gold bars and jewelry may continue to support the market.
Losers:
Gold ETF holders selling at the bottom. These are retail investors who bought gold at the peak (above $2,500 per ounce) and are now exiting in panic, locking in losses. As outflow statistics from Chinese ETFs show, many investors give up after months of volatility.
Gold mining companies dependent on high prices. If gold falls to $2,200–$2,300, many small and mid-tier producers will be on the edge of profitability. While production costs for many are $1,200–$1,500 per ounce, a price drop still squeezes margins and makes new projects uneconomical.
ETF providers (BlackRock, State Street, Vanguard, and others). A decline in assets under management (AUM) in gold ETFs means lower fee income. For State Street, which manages SPDR Gold Shares (GLD) — the world's largest gold ETF — an outflow of $811.94 million in one week is a significant revenue hit.
[What the Media Isn't Saying]
The first and most important omission concerns the real reason for the outflow. The media writes about 'profit-taking' and 'volatility,' but doesn't say that large institutional investors received a clear signal from the Fed: rates will stay higher for longer. High rates are gold's enemy because they increase the opportunity cost of holding a non-yielding asset.
As surveyed experts note, 'short-term gold price volatility is likely to persist, but from a long-term perspective, the fundamental factors supporting gold's value as an allocation asset have not changed.' However, the key word is 'long-term.' Institutional investors think in quarters, not decades. And over the next 6-12 months, gold's outlook looks cloudy.
The second omission concerns central bank purchases. No mainstream outlet mentions that the People's Bank of China has been increasing gold reserves for the 19th consecutive month. Central bank purchases are the only thing keeping gold from falling below $2,300. But these purchases are not visible in ETF flows because central banks buy gold directly on the OTC market or from mining companies.
If central banks cut purchases (which could happen if China needs dollars to support the yuan), the current gold price would crash 10-15% within weeks. This risk is almost never discussed in analytical reports.
And finally, the third omission: almost no one compares gold to bitcoin in the context of capital outflows. ETF data shows that bitcoin ETFs are also seeing outflows (ProShares Short Bitcoin Strategy ETF lost $7.47 million in a week). But while gold loses capital to stocks, bitcoin loses capital to... stablecoins and cash. This is an important distinction. Investors exiting gold stay in risky assets (stocks). Investors exiting bitcoin move to safe assets (cash). This speaks to the different nature of demand for these two assets.
[Forecast: Next 30 Days and 90 Days]
Next 30 days (through early July 2026):
I expect continued outflows from gold ETFs, but at a slowing pace. June already saw outflows of 28 tonnes (about $17 billion), and this trend is likely to persist. The key level to watch is gold at $2,300 per ounce. If this level breaks downward, a new wave of panic selling could begin.
For investors already in gold ETFs, I recommend paying attention to Fed officials' comments. Any signal of a possible rate cut in 2026 (even if only in Q4) could halt outflows and trigger a short-term rebound.
Seasonal factors also play a role. Summer is traditionally a weak season for gold, as physical demand in India (where wedding season ends) and China declines. This exacerbates price pressure.
Next 90 days (through early September 2026):
Here there is a fork. If geopolitical tensions in the Middle East or between the US and China escalate sharply, gold could again become a 'safe haven,' and ETF outflows could turn to inflows. However, the baseline scenario assumes conflicts remain at current escalation levels (high, but not leading to full-scale war). In this case, gold will continue to trade in the $2,250–$2,400 range.
More important is the reaction of central banks to continued ETF outflows. If the People's Bank of China announces new large gold purchases (which it will likely do quietly via the OTC market), this could stabilize prices. If purchases decline, the drop could be significant.
My baseline 90-day forecast: gold will end Q3 2026 at $2,200–$2,350 per ounce. This implies a potential decline of 5-10% from current levels. ETFs will continue to lose AUM, but at a slower pace than in May-June.
The main risk to this forecast is a sharp escalation of geopolitical conflict. Any direct military clash between the US and Iran or China and Taiwan would send gold above $2,700 per ounce within days, and ETF outflows would instantly reverse to inflows. But I assess the probability of this scenario in the next 90 days as low (15-20%).
Editorial Forecast
Asset: Gold (spot XAU/USD). Direction: Continued downtrend over the next 48-72 hours with potential for a 1-2% decline.
Key levels: Current price — around $2,350–$2,370 per ounce (estimate). Nearest support — $2,320, then $2,300. Resistance — $2,400, then $2,430. A break below $2,300 opens the path to $2,250.
Confidence level: Medium (55-60%). On one hand, ETF outflows continue and are institutional in nature. On the other, central bank purchases and physical demand in Asia may limit the decline.
Main risk to forecast: A surprise Fed statement about readiness to cut rates earlier than expected (e.g., September 2026 instead of December). This could trigger a sharp reversal in gold, with prices rising 3-5% in a single day. Watch Jerome Powell's speeches next week — any mention of 'growing recession risks' will be a positive signal for gold.
This forecast is the analytical opinion of the editorial board and does not constitute investment advice. All decisions to buy or sell assets are yours alone.
— Editorial Team