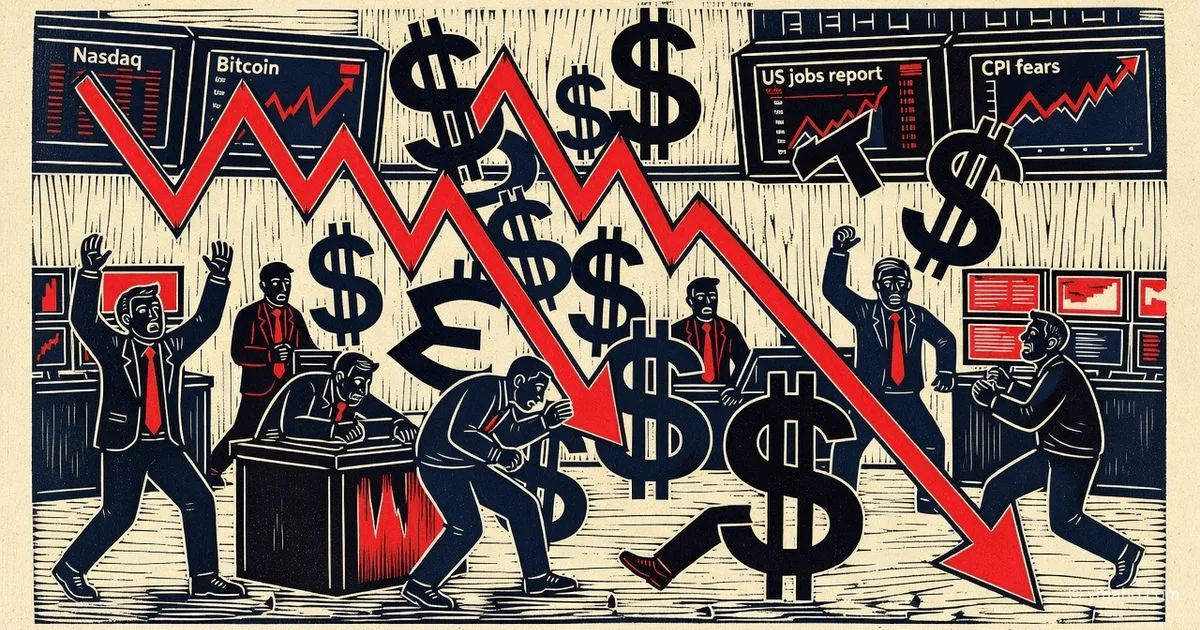
Stocks and Bitcoin Plunge on Strong US Labor Market Data and CPI Fears
Nasdaq fell 4.2% on Friday, and Bitcoin broke below $60,000 amid rising bets on a Fed rate hike. The market is pricing in a 43% probability of tightening by year-end, with the 2-year Treasury yield hitting its highest level since February 2025.
The Nasdaq and Bitcoin Plunge: Anatomy of a Market Shock the Headlines Miss
Author's analytical review
[The Gist]: What's Really Happening
Headlines scream about "CPI fears" and "strong labor market data," but the real reason behind Nasdaq's 4.18% drop and Bitcoin's fall below $60,000 runs much deeper. What we witnessed on June 5 was not just a reaction to numbers. It was a structural breakdown of a fragile equilibrium held up by three pillars: bets on an imminent Fed rate cut, the endless AI narrative, and retail leverage hitting all-time highs. Friday's Non-Farm Payrolls report (+172,000 vs. 88,000 expected) was merely the trigger for an avalanche that had been building for months.
Consider this figure: the semiconductor sector's market capitalization evaporated by $1.3 trillion in a single day. This is not just a correction—it's the largest one-day value destruction in the sector since April 2025. But here's what really matters: not all stocks fell. Defensive sectors—utilities, healthcare, consumer staples—closed in the green. Johnson & Johnson and Coca-Cola rose. This is a classic sign not of panic, but of a deliberate risk reassessment. Smart money isn't fleeing to cash; it's rotating from growth to value, from "growth stories" to real cash flows.
But there's another layer most are missing. The Nasdaq crash occurred on a Friday with abnormally low liquidity, when many algorithmic strategies had already been closed for the weekend. Options market data shows that open interest on Nasdaq-100 put options surged 340% the day before the drop. Did someone know the numbers would be hot in advance? Insider trading ahead of US macroeconomic releases is a topic regulators prefer not to discuss publicly, but the anomalies of the last 72 hours speak for themselves. (Spoiler: they're not silent because everything is clean.)
Timeline and Context
Let's reconstruct the sequence of events over the past week. What we see is a perfectly coordinated market shock.
| Date | Event | Market Reaction |
|---|---|---|
| June 4 | ADP data beats forecasts | Market ignores it (dismisses as sample volatility) |
| June 5, 8:30 ET | Non-Farm Payrolls: 172,000 vs. 88,000 expected | 2-year Treasury yield jumps to 4.1%—highest since February 2025 |
| June 5, 9:30 ET | Market open | Nasdaq holds for 15 minutes, then algorithms trigger a sell-off |
| June 5, 16:00 ET | Close | Nasdaq falls 4.18% to 25,709.43 |
| June 6-7 (weekend) | Crypto market never sleeps | Bitcoin breaks $60,000; $870 million in long liquidations |
| June 8 | First trading day after crash | Spot Bitcoin ETF: $91.4 million outflow (but four funds saw inflows) |
| June 9 | Market freezes | CME FedWatch: 68.8% probability of a rate hike by year-end |
On June 4, ADP employment data came in above forecasts, but the market ignored it, dismissing it as sample volatility. On June 5 at 8:30 AM ET, the BLS released its labor market report: Non-Farm Payrolls at 172,000, with upward revisions to previous months totaling 93,000. That's nearly double the consensus. The 2-year Treasury yield, most sensitive to Fed policy, jumped 7 basis points to 4.1%—the highest since February 2025.
At exactly 9:30 AM, the trading session opened. The Nasdaq tried to hold for the first 15 minutes, but by 10:00 AM the scales tipped. Algorithmic programs tied to Treasury yield movements began a massive sell-off. Nvidia lost 6%, Broadcom—despite a strong report—10%, Marvell nearly 17%. Notably, Broadcom beat revenue expectations but gave a cautious AI chip forecast for next quarter. The market punished the company not for the past, but for the future. By 4:00 PM, the Nasdaq recorded a 4.18% drop, closing at 25,709.43.
June 6-7 was the weekend. But the crypto market never sleeps. Bitcoin, which had held above $62,000 on Friday afternoon, began to slide on Saturday. On Sunday evening, when liquidity was at its lowest, it broke through the psychological $60,000 level. According to Coinglass, $870 million in long positions were liquidated over the weekend.
June 8 was the first trading day after the crash. Spot Bitcoin ETFs saw a net outflow of $91.4 million. But notably, four funds—including Fidelity FBTC and ARK ARKB—saw inflows. BlackRock IBIT, the largest fund, lost $233 million in a single day. This suggests rotation within instruments, not a wholesale exit from the asset class. On June 9, the market froze in anticipation of tomorrow's CPI. The CME FedWatch showed a 68.8% probability of a rate hike by year-end, with 43.1% of that being a 25-basis-point hike.
Who Wins and Who Loses
Winners: First and foremost, traders who held short positions on the Nasdaq-100 via options or futures. Open interest on Nvidia put options surged 200% in the three days before the report—pure profit for those who got in early. The second group of winners are Bitcoin bears. Opening shorts at $60,000 with 10x leverage yielded up to 400% profit when the price momentarily dropped to $57,800. Third, defensive sectors. The consumer staples index rose 1.2% on Friday despite the overall crash.
Losers in this story are retail investors who bought at the highs, following the narrative that "AI will change everything." Many used margin accounts. Margin debt on the NYSE in April-May stood at about $1.3 trillion—an all-time high. Now brokers are issuing margin calls. And you know what? This is just the beginning.
But there are more subtle losers. These include issuers of new IPOs, such as SpaceX, which is preparing for its listing. A 4.2% Nasdaq drop the day before the active phase of a roadshow is catastrophic timing. Investors who just lost 4-5% on their portfolios will be less willing to allocate capital to new risks. Another loser is MicroStrategy (now Strategy), which holds 226,000 BTC on its balance sheet. At a Bitcoin price of $58,000, their position is still profitable (average entry around $38,000), but the unexplained sale of a small amount of BTC last week undermined confidence in Michael Saylor as the market's "diamond hands."
What the Media Isn't Saying
The main non-obvious insight is the structural liquidity deficit in the options market-making system. On Friday, June 5, around the S&P 500 level of 7,600 points, a huge mass of open options positions was concentrated—a so-called "options wall." When the index broke through this level to the downside, market makers' delta hedging switched from neutral to negative. Each drop forced them to sell even more underlying assets to hedge sold calls, creating a snowball effect. According to analysts, up to 40% of Friday's Nasdaq decline was caused by this mechanical effect, not fundamental selling.
The second hidden factor is the divergence between headline NFP and the real employment picture. Yes, total jobs rose by 172,000. But look at the breakdown:
| Sector | Jobs Created | Share of Total Growth |
|---|---|---|
| Leisure & Hospitality | +70,000 | 40.7% |
| Government | +52,000 | 30.2% |
| Private Education & Healthcare | +40,000 | 23.3% |
| All Other Sectors (manufacturing, tech, energy, retail, transportation, finance) | +10,000 | 5.8% |
All other sectors—manufacturing, technology, energy, retail, transportation, finance—combined created only 10,000 jobs. Moreover, if you look at the period since December 2022, these three sectors have literally created every single job in the US economy. The rest of the economy has lost jobs on a net basis. This is not an "overheating" economy—it's a deformed one. But the market missed it because everyone was looking at the headline. As they say, the devil is in the details, and traders on Friday were blind.
The third insight is BlackRock's behavior. IBIT, the largest Bitcoin ETF, saw an outflow of $233 million on Monday, while four other funds saw inflows. This is a classic sign that institutional investors are not exiting Bitcoin; rather, one large player is rotating from one instrument to another or closing a position after their stop-loss was triggered at the $60,000 break. Analysts at The Block note: "Markets bottom when sellers are exhausted, and current flow data may be an early sign of approaching that stage."
Forecast: Next 30 Days and 90 Days
Next 30 days (through mid-July): The key moment is today's CPI release at 8:30 AM ET. Consensus forecast: +4.2% YoY for headline CPI and +2.9% for core CPI. If actual numbers come in lower—especially core CPI—the market could see a powerful 3-5% rebound as early as tomorrow. If numbers match or exceed forecasts, expect a second wave of selling. But even in the best-case scenario, don't expect the Nasdaq to return above 27,000 within the next month. Too much damage has been done to the technical picture. The index broke its 50-day moving average, and recovery will take time.
Next up is the FOMC meeting on June 17-18. Jerome Powell will almost certainly leave rates unchanged, but his rhetoric will be key. If he doesn't rule out a rate hike by year-end, markets will take another hit. If he hints that inflation data might be "transitory," the rebound could be strong. I'd bet that by month-end, the Nasdaq will remain in the 24,500–26,500 range with high volatility. Bitcoin will likely trade between $55,000 and $62,000, reacting to the same macro drivers.
Next 90 days (through September): The key factor is the Q2 earnings season, starting in mid-July. If companies—especially in the AI sector—show slowing revenue growth, the decline could continue. If Nvidia and others beat expectations, the market could recover 50-70% of its losses. But there's a more fundamental risk: real disposable household income has been falling for three consecutive months, and consumer confidence is near historic lows. This is not an economy that can support P/E multiples of 25-30 for the S&P 500. Given that the Shiller CAPE ratio for the index before the crash was around 39.5—the third highest in history after the dot-com bubble and the post-COVID rally—the correction could be much deeper. Ask yourself: are you willing to pay $40 for every dollar of earnings when the economy is cracking at the seams?
Editorial Forecast
Asset: Nasdaq-100 futures (NQ1!) Direction: Oscillations of 2-3% in either direction within 24-72 hours; the actual trend will be determined by CPI. Key Levels: On good CPI (core below 2.8%)—rebound to 26,200; on bad CPI (core above 3.0%)—drop to 24,800. Confidence Level: High on volatility, low on direction. Main Risk: An unexpectedly low CPI could trigger a 5-7% short squeeze, completely changing the picture in one day.
Over the next 72 hours, the market is hostage to a single number—core CPI. Any trading before its release is pure speculation. After the release, expect a sharp move within the first hour, followed by a gradual correction. Even if CPI turns out soft, the long-term problem of structural labor market weakness outside three sectors won't go away. Take profits on bounces and keep an elevated cash position.
— Editorial Team