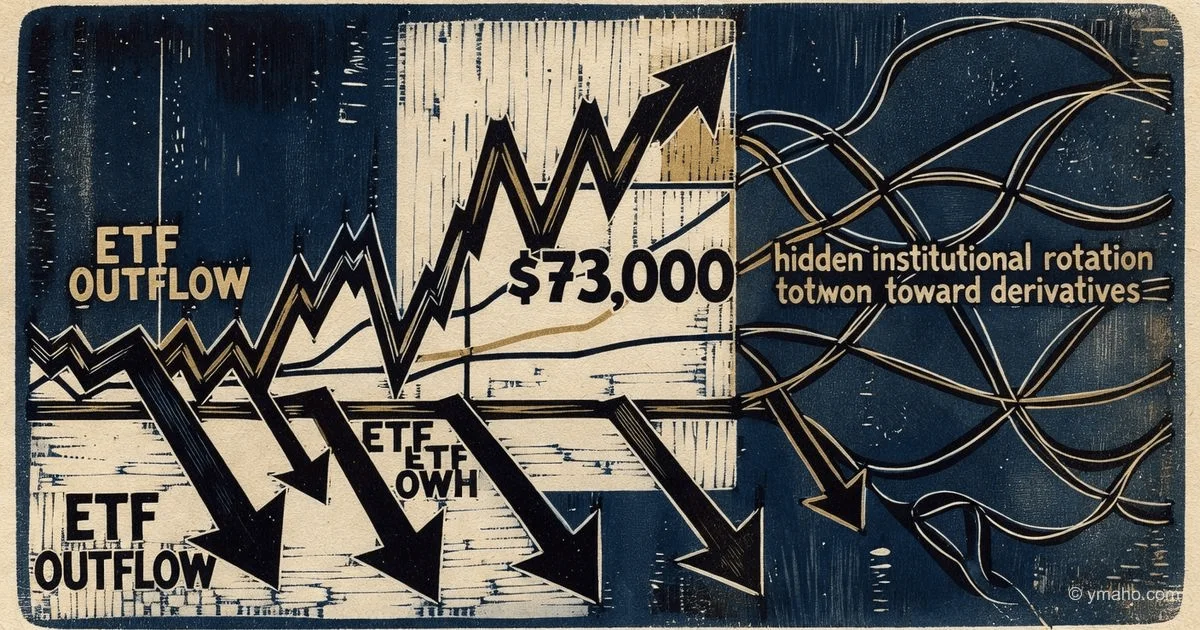
Bitcoin Breaks $73,000 Amid Slowing ETF Inflows
Cryptocurrency hit a monthly high on Binance, despite spot ETFs recording $200 million in outflows over two days. Analysts link the rise to halving expectations.
Analytical Breakdown: Bitcoin at $74,000 — The Paradox of Outflows and Hidden Institutional Shift
[The Gist]: What's Really Happening
Headlines scream about a "mysterious Bitcoin rally amid ETF outflows," and most commentators scratch their heads over this contradiction. But there's actually no contradiction — just a misunderstanding of who's driving the market right now. Spot Bitcoin ETFs have recorded ten consecutive sessions of outflows, pulling nearly $3 billion from the products since May 15, 2026. This is the longest outflow streak in the history of these instruments. Yet Bitcoin hasn't crashed; it's steadily holding above $73,000 and even broke $74,000 on some exchanges.
How is this possible? The answer is simple and simultaneously shocking for those used to thinking ETFs are the only institutional gateway into crypto. CoinGecko data shows Bitcoin trading around $74,044, with 24-hour volume exceeding $10.6 billion. The rise is happening not because of ETFs, but despite them. Who's buying? Two sources: direct purchases through regulated derivatives platforms following the recent CFTC approval for Coinbase (which we covered in a previous analysis) and, more importantly, capital rotation within the crypto market itself.
The real essence: institutional investors aren't leaving Bitcoin — they're changing their entry method. Spot ETFs were convenient in 2024-2025 when alternatives were scarce. Now, after the CFTC on May 29 allowed Coinbase via Deribit to give US institutions direct access to global crypto derivatives [from previous analysis], large funds can trade futures and options directly, without ETF fees and with leverage. It's as if everyone suddenly realized that instead of buying a gold ETF with a 0.25% fee, they could buy a gold futures contract with 10x leverage and zero fees. Of course, they'll migrate.
Timeline and Context
The timeline of the last two weeks paints a picture completely at odds with the official narrative. On May 15, 2026, a series of outflows from spot Bitcoin ETFs began, reaching ten consecutive days by May 29, with cumulative outflows of about $3 billion. Total net ETF assets fell from $104.29 billion to $94.17 billion in just two weeks. This should have crashed the price.
But Bitcoin behaved differently. On May 27, it closed at $75,877, then corrected, and by May 30, the price dropped to a seven-week low around $72,000. However, instead of continuing to fall, a sharp reversal followed. By May 31, Bitcoin recovered to $73,600-$73,900, and on June 1, it was trading around $74,044. In a few days — a recovery of nearly 3% from the local bottom.
What happened on May 29-30? Two key events. First, the CFTC decision on Coinbase and Deribit, which opened direct institutional access to global liquidity [from previous analysis]. Second, futures market data showed traders added about $300 million in new margin long positions in the $73,000-$74,000 range. These aren't retail investors with their $100-$1,000 — this is institutional money entering through derivatives, not ETFs.
Additional context: the market is exactly in the time window that historically preceded the formation of cyclical bottoms. According to CryptoQuant, Bitcoin is about 705 days after the April 2024 halving, and in previous cycles of 2016 and 2020, bottom formation began around day 777. This window is late May to mid-June 2026. We are right in the epicenter of this historical pattern.
Who Wins and Who Loses
Winners #1: Institutional investors who moved from ETFs to direct derivatives. They win twice. First, they save on ETF fees (averaging 0.25-0.90% annually). Second, they get access to leverage — the ability to control a position 2-3 times larger with the same capital. Third, they can hedge with options, which ETFs don't allow. CME Group, the largest regulated futures venue, still holds $7.55 billion in open interest for Bitcoin futures. This isn't an outflow — it's just a channel shift.
Winners #2: XRP holders. While everyone watches Bitcoin, a quiet capital rotation is happening within crypto. XRP ETFs attracted nearly $12 million in new net inflows in the last session, against ten days of outflows from Bitcoin ETFs. This is no coincidence. Investors take profits in Bitcoin after its rise and reinvest in altcoins with lower market caps and greater movement potential. XRP benefits directly from this rotation.
Winners #3: Binance as a trading platform. Open interest in Bitcoin futures on Binance is about $10.4 billion, giving the exchange a 19.14% share of the global futures market. Binance is capturing market share that CME is losing (down from $18 billion to $7.55 billion since October 2025). Institutional players are moving from CME to Binance and other crypto exchanges because of deeper liquidity and more trading hours. Binance is the hidden beneficiary of this flow.
Losers #1: Bitcoin ETF issuers — BlackRock, Fidelity, Grayscale. Ten consecutive days of outflows is the worst performance since these products launched in January 2024. BlackRock's IBIT lost $68.2 million in the last session alone, and Fidelity's FBTC lost $31.95 million. Their business model, built on custody fees, crumbles when clients leave. If the trend continues, some ETFs may become unprofitable and close.
Losers #2: Margin traders who opened short positions on ETF outflows. They saw $3 billion in outflows and decided Bitcoin would crash to $65,000, as some analysts predicted. Instead, they got a rise to $74,000 and had to close positions at a loss. According to Coinglass, on May 31 alone, about $150 million in short positions were liquidated.
Losers #3: Investors who believed in a "bear market until 2027." CryptoQuant CEO Ki Young Ju stated that the current downtrend could persist until early 2027. Those who sold Bitcoin on these forecasts around $70,000-$72,000 are now watching the rise and can't re-enter at a better price. This is a classic mistake — taking a forecast as fact.
What the Media Isn't Saying
Non-obvious Insight #1: ETF outflows are not panic, but strategic rotation before the halving. No one says this openly, but big players know: the next Bitcoin halving is expected in about 1 year and 298 days. That's still far off, but preparation begins 12-18 months in advance. The strategy is simple: pull capital out of ETFs, where it sits passively, and move it into active trading strategies via derivatives to accumulate a position before the next halving at a better price. The $3 billion outflow isn't a "flight from Bitcoin." It's a "troop redeployment before an offensive."
Proof? Look at Deribit options data. There's $8.5 billion in notional value expiring June 26, 2026, with max pain around $77,500. That's 5.3% above the current spot price of $73,600. Someone very large opened positions that will only be in the money if Bitcoin rises 5-7% by end of June. Meanwhile, open interest in options on CME has been heavier in puts (bearish) than calls since November 2025. This is called hedging — big players insure against a drop while simultaneously betting on a rise through futures. Media see only puts and scream bearish sentiment. But pros see both puts and futures and understand: it's a balanced book, not a one-sided bet.
Non-obvious Insight #2: The volume of ETF outflows is overestimated due to double counting. When media report $3 billion in outflows over 10 days, they sum gross outflows. But the real net outflow may be smaller due to the ETF creation and redemption mechanism. Market makers could redeem one ETF while simultaneously creating another, shifting Bitcoin between providers. BlackRock institutional clients might move to Fidelity, which would count as an outflow from one and inflow to another, but wouldn't show in net flow.
Moreover, Santiment directly stated that previous episodes of extreme outflows historically coincided with Bitcoin cyclical bottoms. In November 2025, there was a one-day outflow of about $904 million that preceded a sharp price recovery. The current pattern isn't unique — it repeats. And every time, journalists write "bearish signal," and a week later, "unexpected rally." Historical memory in crypto journalism, apparently, doesn't extend beyond 6 months.
Non-obvious Insight #3: CME is losing futures market share, and this shifts the balance of power. In October 2025, at the market peak, CME had about $18 billion in Bitcoin futures open interest, while Binance had about $15 billion. Today, CME has fallen to $7.55 billion, while Binance holds at $10.4 billion. CME has lost over 58% of its OI since October, while Binance only 30%.
What does this mean? Institutional players, who previously preferred CME for regulatory certainty, now feel comfortable enough on Binance and other crypto exchanges. This followed a series of regulatory wins for the crypto industry in the US: the CLARITY Act, the Coinbase derivatives approval, and the friendly stance of the Trump administration. Regulatory risk has dropped so much that funds no longer fear holding billions on Binance. This is a tectonic shift that goes unmentioned because it contradicts the "Bitcoin is only ETFs" narrative.
Forecast: Next 30 Days and 90 Days
30 days (to early July 2026): Bitcoin will likely remain in the $70,000-$78,000 range with an upward breakout attempt. Key date: June 26, 2026, when $8.5 billion in Deribit options expire with max pain at $77,500. In the 7-10 days before expiration, market makers will start pulling the price toward the max pain level to minimize their payouts. This means between June 16 and 26, we could see a move to $77,000-$78,000. If Bitcoin breaks $78,000 and holds above, the next target is $82,000.
Technical analysis: current RSI at 37.8 — oversold zone, but not extreme. MACD remains bearish, indicating a possible retest of support at $70,280. Nearest support is $73,425, then $71,965 and $70,280. Resistance is $74,571, then $76,648 and $78,601. A return above $74,571 on rising volume would neutralize the MACD bearish signal.
The main risk this month is geopolitics. If US-Iran talks collapse and Brent crude goes above $100 per barrel, risk assets, including Bitcoin, could crash to $65,000-$68,000. The Fed could also surprise at its June 16-17 meeting — any mention of a possible rate hike (rather than a cut) would trigger panic.
90 days (to September 2026): The scenario here heavily depends on two factors: institutional demand through new channels (Coinbase+Deribit) and the macroeconomic situation. Optimistic scenario: if the CFTC allows Coinbase retail clients access to Deribit derivatives (currently only institutions), trading volume could increase 50-70%, and Bitcoin could reach $85,000-$90,000 by end of summer.
Pessimistic scenario: if ETF outflows continue for another 2-3 weeks and reach $5-6 billion cumulatively, the psychological effect could crash the price to $65,000, despite these outflows fundamentally not reflecting real demand. The Fear and Greed Index is already at 23 ("extreme fear"), which historically preceded reversals, but fear could intensify.
Base scenario: Bitcoin consolidates in the $72,000-$82,000 range until September, then, after the ETF outflow season ends (and it will end — it's a cyclical pattern), a gradual recovery to $90,000+ by end of 2026 begins. Structurally, Bitcoin remains in a long-term uptrend despite all the volatility of recent months.
Editorial Forecast
Asset: Bitcoin (BTC/USD). Direction: Consolidation with upward bias over the next 24-72 hours. Key levels: support — $73,400-$73,500, resistance — $74,600-$75,000. Confidence level: medium (55-60%). Main risk: a sudden hawkish shift in Fed rhetoric at the upcoming June 16-17 meeting could trigger risk asset selling before the market prices in the approaching options expiration. The Fear and Greed Index at 23 indicates the market is in "extreme fear" territory, which historically has been favorable for buying but does not guarantee an immediate reversal. It is recommended to refrain from opening large positions until a clear signal emerges: either a breakout above $74,600 with volume confirmation, or a test of support at $70,280.
— Editorial Team