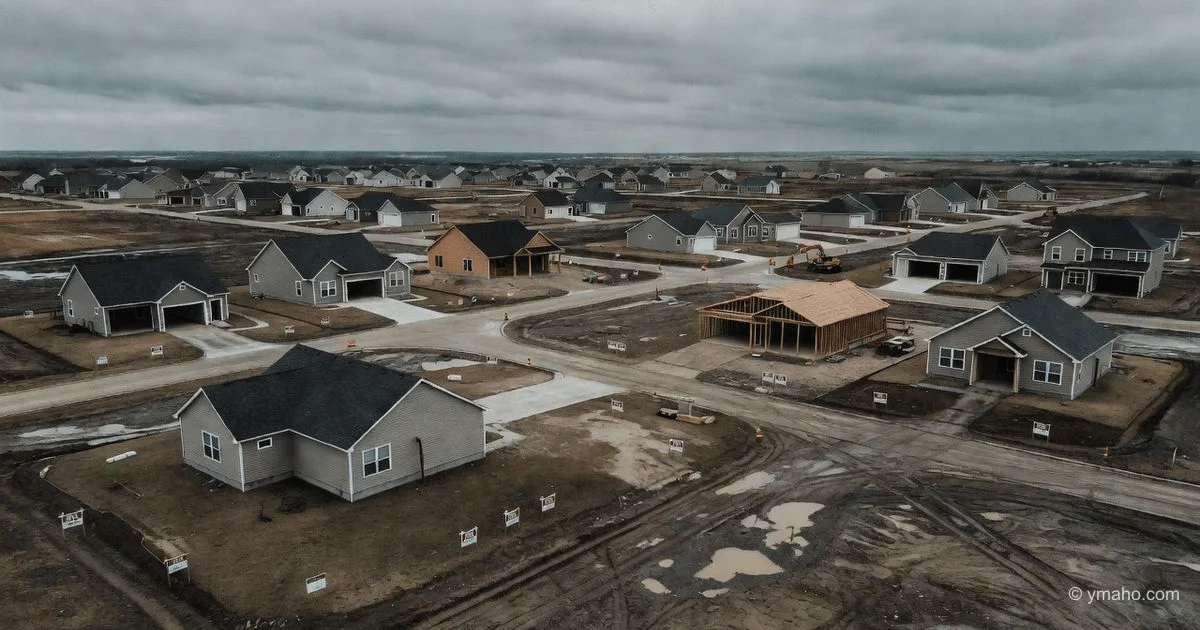
Lennar Quarterly Report Misses Forecasts Due to High Mortgage Rates
Lennar (LEN) reported EPS of $2.94 versus a forecast of $3.12, with revenue of $7.8 billion. The company lowered its annual home delivery forecast, and homebuilding stocks fell an average of 3.2%.
A Crack in the Foundation: Why Lennar's Miss Is a Diagnosis for the Entire US Housing Market
[The Gist]: What's Really Happening
On the evening of June 11, 2026, Lennar (LEN) — the second-largest homebuilder in the US — released its second-quarter report, which served as a mirror reflecting the systemic crisis in housing affordability. The formal numbers: revenue of $7.94 billion versus a forecast of $8.0–8.1 billion, GAAP earnings per share of $1.24 against a consensus of $1.25. But it's not these small deviations that matter; it's what lies behind them.
For the fifth consecutive quarter, Lennar has missed market expectations on key metrics. Gross margin in homebuilding plummeted from 17.8% a year ago to 15.6%. The average home selling price fell to $371,000 from $389,000 a year earlier. This is no coincidence — it's a systemic trend, forcing the company to stimulate demand through record incentives of 12.9%.
But the most alarming part is the forecast. Lennar lowered its annual home delivery target to 82,000-83,000 units (previously 85,000). The third-quarter delivery forecast (20,500-21,500 homes) came in below the analyst consensus of approximately 22,353 units. CEO Stuart Miller stated outright: "The quarter was defined by the same stubborn headwinds that have challenged the housing market for the past few years — persistently high mortgage rates, limited affordability, and cautious consumer sentiment."
| Metric | Q2 2026 | Q2 2025 | Change | Forecast | Deviation |
|---|---|---|---|---|---|
| Revenue, USD billion | $7.94 | $8.38 | -5.2% | $8.0-8.1 | Below |
| GAAP EPS, USD | $1.24 | $1.81 | -31.5% | $1.25 | Slightly below |
| Average selling price, USD | $371,000 | $389,000 | -4.6% | — | — |
| Gross margin | 15.6% | 17.8% | -2.2 pp | — | — |
| Incentives | 12.9% | 13.3% (2025) | — | — | — |
| Home deliveries, thousands | 20.52 | 20.00 | +2% | — | — |
Timeline and Context
Lennar's decline didn't happen overnight. It's the result of a prolonged contraction in the US housing market under the pressure of the "new normal" of high rates. The Fed maintains its rate at 4.5% (decision from June 10, 2026), with no signals of an imminent easing. Mortgage rates, as a result, remain in the 6.5-7.5% range, making the monthly payment on a typical home unaffordable for the average American.
An additional blow came from inflation — it unexpectedly accelerated to 4.2% in May 2026. This is nearly 1.5 percentage points above the Fed's target and completely nullifies hopes for rate cuts in 2026. Moreover, it directly hits the construction sector through the cost of materials and labor.
Lennar is trying to adapt. The company continues its "volume over margin" strategy, deliberately sacrificing profitability to maintain production volumes and platform utilization. Since the previous cycle (2022-2024), Lennar has reduced direct construction costs by 13% and shortened the construction cycle to 121-122 days. But these efforts are insufficient when demand contracts faster than costs.
| Factor | Current State | Impact on Lennar |
|---|---|---|
| Fed rate | 4.5% | Keeps mortgage rates high |
| CPI inflation | 4.2% YoY | Pressures costs and consumer sentiment |
| 30-year mortgage rate | ~6.8-7.2% | Makes home purchases unaffordable for 40% of potential buyers |
| Construction costs | -13% over 2 years | Partially offsets margin decline |
| Construction cycle | 121 days | Record low, improves turnover |
Who Wins and Who Loses
The biggest loser: Lennar shareholders. Shares fell 2-3% in after-hours trading following the report. But the key story here isn't the one-day move; it's the long-term trend: LEN shares trade in a 52-week range of $81.18 to $144.24, meaning they've already lost nearly 36% from the peak. The drawdown at lows reached levels around $90 per share.
Also losing: Lennar's suppliers and subcontractors. When a homebuilder squeezes its margin to 15.6%, it inevitably passes pressure down the chain. Lennar has already achieved a 13% reduction in direct construction costs over two years. This means concrete workers, roofers, window manufacturers, and plumbing suppliers are working with lower profitability or losing volumes.
Winners: competitors with a stronger position in the affordable housing segment. D.R. Horton (DHI) and PulteGroup (PHM) may be weathering this cycle better, as their portfolios are skewed toward entry-level homes. Also relatively winning is the rental business — companies like Invitation Homes (INVH) and American Homes 4 Rent (AMH), which buy homes when sales fall and rent them out at rising rates.
A hidden winner: large institutional investors who bought Lennar on the dip. The company repurchased 5 million of its own shares for $447 million during the quarter. This signals that management considers the shares undervalued. And although the report was weak, shares rose 5.46% after its release — the market saw this bounce as an opportunity, not a sell-off.
| Participant | Win/Loss | Reason |
|---|---|---|
| Lennar shareholders | -36% from 52-week high | Fifth consecutive quarter missing expectations |
| D.R. Horton (DHI) | Relative win | Stronger position in affordable segment |
| Invitation Homes (INVH) | Win | Rising rental rates amid falling sales |
| Lennar (buyback) | Buyback of $447 million | Signal of undervaluation from management |
What the Media Isn't Saying
First and foremost non-obvious insight: Lennar's decline is not so much a story about rates as it is about the limitations of the asset-light model. Lennar has long boasted that less than 5% of land is on its balance sheet, with the rest being options to purchase. In a rising market, this is brilliant: you don't tie up capital in land. In a falling market, you lose control over costs because you can't lock in option prices years ahead. Land suppliers, seeing falling demand, don't lower prices — they wait. Lennar gets squeezed between high option prices and the need to sell homes cheaper.
Second fact missing from headlines: lowering the annual forecast to 82,000-83,000 homes means Lennar is tacitly admitting that mortgage rates won't return to 5% until at least 2028. If management believed in a Fed pivot in the second half of 2026 (and the Fed hinted at two cuts), they would have maintained or even raised the forecast. Lowering it is a hedge against "higher for longer."
Third hidden factor: Lennar's technology investments aren't working as promised. The company invested billions in the "Lennar Machine" (a Salesforce-based CRM), a land management system from Palantir, and an ERP from JD Edwards. The goal was to lower customer acquisition costs and speed up the cycle. But in the report, we see margins falling and incentives rising. Technology isn't compensating for the macroeconomic hit. Moreover, losses from technology investments (mark-to-market) were excluded from adjusted EPS, but they are real and account for the difference between $1.24 GAAP and $1.31 non-GAAP.
| Hidden Factor | Why It Matters |
|---|---|
| Asset-light model fails in a falling market | Lennar doesn't control land costs through options |
| Lowered delivery forecast | Sign that rates will stay high for long |
| Tech investments not paying off | Losses excluded from adjusted EPS, but they are real |
| Record incentives of 12.9% | Demand is artificially stimulated, inventories grow |
Forecast: Next 30 Days and 90 Days
30 days.
Lennar shares will likely remain in the $85-100 range. On one hand, the post-report bounce of 5.46% showed that the "bottom" is near. On the other, macroeconomic data (4.2% inflation, Fed rate hold) won't allow the housing market to turn around. Key resistance level is $105 (50-day moving average), support is $81 (52-week low).
In the next 30 days, there will be no new catalysts from Lennar itself, aside from traditional weekly rate data. If mortgage rates fall below 6.5%, shares could test $110. If they rise above 7.5%, a retest of $85 is likely.
90 days.
By September 2026, Lennar will report third-quarter results. The key question: can the company meet its own delivery forecast (20,500-21,500 homes) and improve gross margin to 16%? If yes, shares could return to the $110-120 range. If not, a further forecast cut for 2027 will follow, and the price will drop to $70-80.
I assess the probability of meeting the margin forecast as low (30%). Reasons: incentives remain high, and competition for buyers is only intensifying. A more likely scenario is that margin stays around 15.5%, and deliveries come in at the low end of the range or below. This means Lennar faces another disappointing quarter in September.
| Period | Pessimistic | Base | Optimistic |
|---|---|---|---|
| 30 days | $82-92 | $88-100 | $98-108 |
| 90 days | $70-85 | $85-105 | $105-125 |
| Key factor | Mortgage rates | Meeting delivery forecast | Fed rate cut in fall |
| Probability | 35% | 50% | 15% |
Editorial Forecast
Lennar (LEN) shares will continue to consolidate in the $88-95 range over the next 24-72 hours following the initial positive bounce of 5.46%. We expect a gradual decline toward the lower end of the range as the market realizes the long-term implications of high mortgage rates. Confidence level: moderate (55%). The main risk to this forecast is an unexpected Fed statement signaling readiness to cut rates as early as July, which could trigger an 8-12% rally across the homebuilding sector. This is an editorial opinion, not an investment recommendation.
— Editorial Team