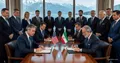
WTI Crude Plunges Below $80 on Reports of US-Iran Ceasefire
Oil prices tumbled more than 5% after reports of a ceasefire memorandum that would lift sanctions on Iranian oil exports. This weighed on the dollar but supported the Dow Jones, which rose 0.64%.
Analytical Breakdown: Oil Crash on Words — Fragile Ceasefire vs. Harsh Logistics
Author's Analytical Review
The Core: What's Really Happening
The oil market experienced a shock correction — WTI futures plunged over 5% to $75.80 per barrel, Brent fell to $78.80, hitting the lowest levels since March 2026. The formal trigger was President Trump's announcement of a preliminary peace agreement with Iran and the imminent reopening of the Strait of Hormuz. But the real story runs deeper: for the first time in four months, the market began pricing in de-escalation rather than escalation — and it happened with the speed characteristic of oil shocks.
However, beneath this surface narrative lies a fundamental mistake by traders that I see in every such move: they confuse a political announcement with actual supply restoration. The agreement, scheduled for signing on June 19 in Switzerland, is merely a memorandum of understanding, not a final peace treaty. It extends the April ceasefire for another 60 days and opens a window for negotiations on nuclear issues and sanctions.
The market is pricing in the "removal of the geopolitical premium" — and that's key. The question isn't whether the document will be signed on Friday. The question is how long it will take for Iranian oil to physically return to global markets. The answer: weeks to months, and according to the US Department of Energy, not before the end of the year.
Timeline and Context
To understand the scale of what's happening, we need to reconstruct the chain of events that led to the current price.
| Date | Event | Brent / WTI Price |
|---|---|---|
| 02/28/2026 | US and Israeli strikes on Iranian positions, effective blockade of the Strait of Hormuz | ~$95-100 per barrel (peak levels) |
| April 2026 | First temporary ceasefire, partial stabilization, but the strait remains closed | $85-90 |
| 06/11-12/2026 | Iran publishes a draft 14-point memorandum, including lifting the blockade within 30 days | $83-85 |
| 06/15/2026 | Trump on Truth Social: "Ships of the world, start your engines" | Brent falls to ~$83 |
| 06/16/2026 | Leaked details: sanctions on oil lifted immediately after signing | WTI loses 5% to $80.6, Brent to $83 |
| 06/17/2026 | Trading continues to decline: WTI $75.80, Brent $78.80 | Lows since March |
Key nuance that the media barely covers: the blockade has already been partially lifted. According to Iranian media, three Iranian tankers are already in Northern India, and another two with cargoes are heading to southern Iranian ports. But this is just a drop in the ocean compared to the previous traffic of 20 million barrels per day.
The memorandum itself, according to leaked copies, contains a mechanism: the US lifts the naval blockade immediately after signing, but restoration of shipping to "pre-war volumes" takes 30 days. Iran, in turn, commits to neutralizing the minefields it laid in the strait.
Who Wins and Who Loses
Biggest winners — airlines and transportation companies. A 5-7% reduction in fuel costs over the quarter directly improves margins. Shares of Delta Air Lines, United, and European airlines will get a boost if prices settle below $80. However, there's a nuance: long-term fuel contracts that most carriers hedge have already locked in higher prices for Q2 and Q3. The effect will be delayed.
Consumer companies and retail. Walmart, Target, automakers — lower logistics costs mean easing inflationary pressure. This factor supported the Dow Jones, which hit an all-time high amid the oil drop.
Asian oil importers win. Japan, South Korea, China, India — countries dependent on Middle Eastern supplies get a double bonus: cheaper oil and lower insurance premiums for transport. Japan's Nikkei 225 rose 5% to record levels.
Losers — and significantly so — US shale oil producers. The breakeven point for many shale projects in the Permian Basin is in the $65-75 per barrel WTI range. Current $75.8 is already the zone where marginal producers start cutting drilling. If the price settles below $75, we'll see a slowdown in US production growth as early as Q3.
Does the dollar lose? It's more complicated. The dollar index did show a decline amid falling oil prices, because the "oil-dollar" correlation works inversely in the short term: cheap oil reduces demand for the dollar as a "reserve currency for buying commodities." However, the hawkish Fed signal, which we covered in the previous analysis, exerts opposite pressure.
Hedge funds with long oil positions. According to CFTC data, a week earlier, managers held some of the largest long positions since the start of the conflict. Now they are forced to close out urgently — this, not fundamental changes, created additional pressure on the market on Monday and Tuesday. Mass exit from long positions amplified the drop by 1-2% beyond fundamental justification.
What the Media Isn't Saying
Here are three insights missing from Bloomberg and Reuters headlines.
Insight one: signing the agreement is the beginning, not the end of uncertainty.
The June 19 memorandum is a document of intent. The final agreement must be signed within 60 days after the start of negotiations on nuclear issues and sanctions. Anything can happen in that time — from new strikes to a breakdown in talks. Vice President JD Vance has already called the document "very general," and Trump denied the $300 billion figure for rebuilding Iran, calling it "fake news."
Critically important: Israel distanced itself from the April ceasefire and is not participating in the new agreement. This means any Israeli strike on Iranian proxies in Lebanon or Syria could nullify the deal at any moment. Experts are unanimous: the realistic forecast is a "temporary lull" for a few months, but no more.
Insight two: even with the strait fully open, oil won't return to $80 tomorrow.
The region's infrastructure is severely damaged. It's not just about mines in the strait, but also damaged terminals, refineries, and logistics chains. The head of Mitsui OSK Lines (the largest tanker operator) told the Financial Times that shipowners won't resume transit for several weeks — until they see the deal working in practice.
Insurance premiums for vessels entering the region will remain above pre-crisis levels. PVM Oil Associates calculated that even in the best case, full restoration of 20 million barrels per day traffic will take months. Returning to pre-war balance requires 60-70% recovery, but that alone will take at least 2-3 months.
Insight three: the market isn't factoring in the counterblow — "Iranian oil" ≠ "cheap oil."
Iran will return about 1-1.5 million barrels per day to the market within 3-6 months. But this volume is what OPEC+ will have to offset with cuts. Saudi Arabia and the UAE, which increased production during the conflict, will have to adjust quotas. This means total supply will increase, but not by the full 1.5 million — part will be "eaten" by cuts from other producers.
Moreover, the return of Iranian oil coincides with the seasonal demand peak (Q3) and the possible reinstatement of sanctions on Russian oil, which Trump has also mentioned. If the US does reinstate sanctions on Russian exports, the effect of Iranian oil will be partially offset.
Forecast: Next 30 Days and 90 Days
30 days (mid-July 2026):
The next month will be determined by three factors: technical recovery after the crash, negotiation dynamics, and actual shipments.
- Technical picture: WTI broke support at $80 and is now testing $75. If it holds below, the next support is $70, the level where shale producers start seriously cutting drilling.
- Negotiation process: The June 19 signing will create a short-term positive backdrop, but if Israel strikes, prices will return to $85-90 within hours.
- Physical shipments: Real growth in Iranian exports will begin no earlier than 3-4 weeks after signing.
Most likely range for WTI: $73-82. A break below $73 is possible only with a rapid and sustained recovery of traffic through the strait (unlikely).
90 days (September-October 2026):
By this horizon, it will become clear whether the agreement works in practice. If traffic through the strait recovers to 60-70%, we'll see a sustained decline in prices to $70-75. However, if nuclear talks stall or Israel provokes, prices could return to $85-90.
Key macro indicator: if the oil price decline continues and inflation slows faster than the Fed expects, central banks (including the Fed) may soften rhetoric. This would support risk assets but weaken the dollar, creating mixed pressure on oil.
My base case for 90 days: WTI in the $72-78 range, Brent $76-82. The "fast recovery" scenario (WTI below $70) has about 25% probability. The "deal collapse" scenario (WTI above $85) — about 20%. The rest is volatile sideways movement with gradual decline.
Editorial Forecast
Asset: WTI Crude. Direction: Likely consolidation near $75-77 in the next 24-72 hours with a technical bounce to $78-79, as the market is oversold and fundamental supply deficit persists. Key levels: support $73, resistance $80. Confidence level: medium. Main risk: if Iran starts supplying oil faster than expected, or rumors of full-scale return of Iranian volumes are confirmed, WTI could test $70. This opinion is analytical and not an investment recommendation.
— Editorial Team