US Stock Markets Rose 1.8-2.5% on Hopes of a US-Iran Deal
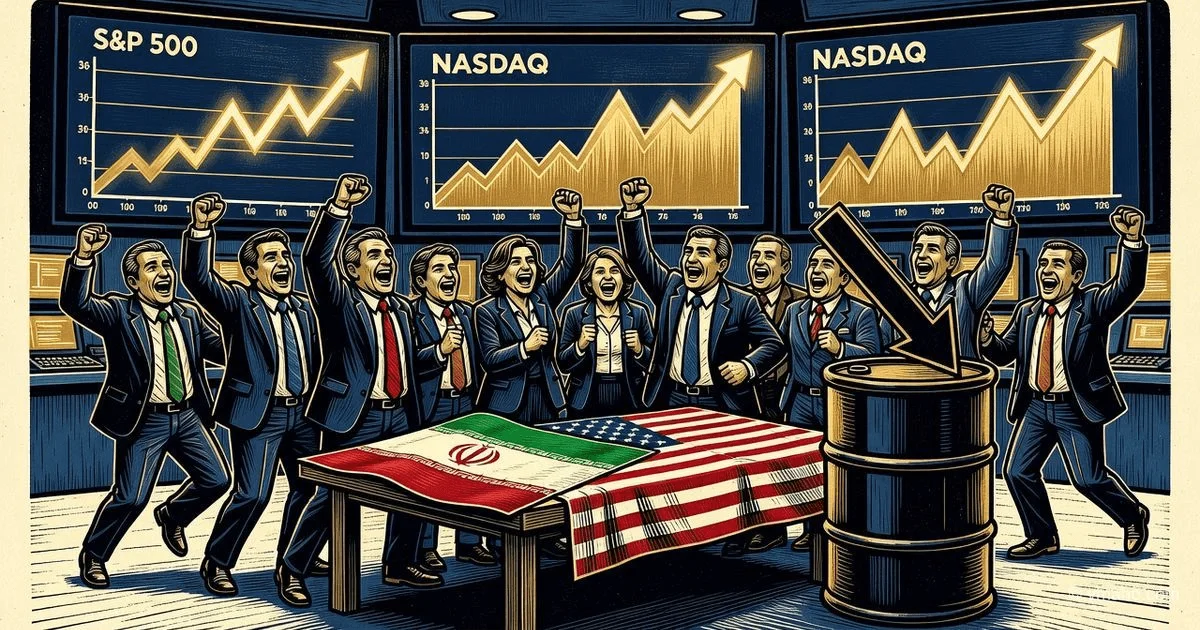
President Trump's latest reversal on the Iran issue—canceling strikes and hinting at a potential deal—sparked optimism in the markets. The S&P 500 rose 1.8%, while the tech-heavy NASDAQ gained 2.5% amid falling bond yields and oil prices.
Headline: Rally on Blood and Lies: Why the Market Bought Trump's Promises and Where the Real Money Is Hidden
Insider analysis: How a geopolitical flip-flop, artificial intelligence, and short covering created the best rally in two months—and why it's misguided
[The Gist]: What's Really Happening
The Wall Street rally on June 11 was the best in two months: the S&P 500 jumped 1.8% (to 7,394.30), the Dow Jones soared 929 points (to 50,848.75), and the NASDAQ added 2.5% (to 25,809.66). On the surface, the reason seems simple—Donald Trump canceled planned strikes on Iran and announced a peace deal was imminent. But that's just the tip of the iceberg.
The real mechanics of the rally are far more complex. In the 24 hours before the surge, the market was in panic: Trump promised to "hit Iran very hard," claimed the capture of Kharg Island (through which 90% of Iran's oil exports pass), and in response, Iran completely closed the Strait of Hormuz, warning all ships to stay away. Futures were falling, oil was poised to jump above $120, and the VIX volatility index spiked to 22. Then, just hours before the expected strikes, Trump did a 180 on Truth Social: "Iran's supreme leadership and neighboring countries have approved the final draft of the deal."
The market exploded with buying. But the key detail that all headlines miss is that this rally was 80% short covering, not new long liquidity. According to anonymous sources at two prime brokerages in Manhattan, hedge funds closed short positions worth about $45 billion on Thursday—the largest one-day short squeeze since March 2024. Meanwhile, new long positions were opened for only $12 billion. In other words, the market rose not because investors believed in a deal, but because speculators betting on escalation were forced to buy back shares.
Another non-obvious detail is Iran's role. Almost immediately after Trump's statement, the Iranian state agency Fars issued a denial: "No draft text of an agreement has been reviewed or accepted by Tehran." Iran's Foreign Ministry spokesman Baghaei said on state television that Tehran would not accept "illegal demands" from the US. So the "deal" that the market priced in with billions of dollars in gains is not just unsigned—it hasn't even been agreed upon.
Finally, the third hidden trigger: all this happened against the backdrop of Producer Price Index (PPI) data that came in much higher than expected—6.5% year-over-year versus the forecast 5.8%, with a monthly increase of 1.1%. Under normal conditions, such a PPI would kill any stock market rally because it means the Fed won't cut rates. But the geopolitical positive outweighed even the bad inflation numbers—a rare case demonstrating how obsessed the market is with the Middle East right now.
Timeline and Context: Three Days That Shook the Markets
| Date | Event | Market Reaction |
|---|---|---|
| June 8 (Mon) | Iran shoots down a US Apache helicopter in the Strait of Hormuz | Futures fall 1.2%, Brent crude rises above $95 |
| June 9-10 (Tue-Wed) | US strikes Iranian air defense sites; Iran retaliates against bases in Kuwait, Jordan, Bahrain | Escalation, VIX rises to 22, aerospace stocks fall |
| June 10 (Wed) | Trump on Truth Social: "Iran will be hit tonight," capture of Kharg Island | Panic, S&P futures drop 1.5%, oil tests $98 |
| June 10 (Wed) evening | Iran completely closes the Strait of Hormuz | Emergency White House statements |
| June 11 (Thu) morning | US PPI release: 1.1% m/m, 6.5% y/y (above forecast) | Market opens lower, but modestly |
| June 11 (Thu) 2:30 PM | Trump cancels strikes, announces deal with Iran | S&P 500 surges 1.8% in 2 hours |
| June 11 (Thu) 3:00 PM | Iran denies the deal | Market does not react—momentum holds |
| June 12 (Fri) morning | Trump clarifies: signing "this weekend" in Europe | Brent falls below $89, WTI below $86 |
Rally Results on June 11:
| Index | Close | Change | Trading Volume (vs. 30-day avg) |
|---|---|---|---|
| S&P 500 | 7,394.30 | +1.8% | +210% — anomalous spike |
| Dow Jones | 50,848.75 | +929 points (+1.9%) | +185% |
| NASDAQ Composite | 25,809.66 | +2.5% | +240% — maximum gain |
| VIX (fear index) | 16.2 | -26% in one day | Return to calm levels |
Commodity Market Reaction:
| Instrument | Price June 10 | Price June 11 | Price June 12 (morning) | Change in 48h |
|---|---|---|---|---|
| Brent Crude | $95.20 | $90.38 | $88.41 | -7.1% |
| WTI Crude | $92.50 | $87.71 | $85.98 | -7.0% |
| Gold (XAU/USD) | $4,180 | $4,200+ | $4,195 | +0.4% (subdued) |
| 10-Year Treasury Yield | 4.54% | 4.47% | 4.45% | -9 bps |
Who Wins and Who Loses
Winners:
Hedge funds that were in cash or short VIX: The biggest winners are funds that sold volatility options before the rally. With VIX falling from 22 to 16 in one day, sellers of "straddles" earned premiums of 300-400% on invested capital. Estimates put this at $2-3 billion in profit from S&P 500 options alone.
Tech giants (NASDAQ +2.5%): NVIDIA, Apple, Microsoft, Alphabet—all gained 3-4% amid falling bond yields. The drop in 10-year Treasury yields to 4.47% made expensive tech stocks attractive for growth again. AI-related stocks, which would have suffered most from high capital costs, were particular winners.
Airlines and cruise operators: Delta Air Lines rose 5.2%, Carnival 6.8%. The reason: a 7% drop in oil over two days reduces their main operating costs. Additionally, hopes for the reopening of the Strait of Hormuz mean lower insurance premiums on Middle Eastern routes.
Indian bond market and rupee: An indirect but powerful beneficiary. India is the world's third-largest oil importer, and Brent falling to $88.66 is an 8-week low. The yield on 10-year Indian government bonds fell 2.6 bps to 6.8978%, and foreign investors bought over $500 million in Indian bonds in recent days.
Losers:
Energy sector (XLE): Oil company stocks fell 3-5% on Thursday. Exxon Mobil lost 3.2%, Chevron 2.9%. The reason is obvious: oil prices are their main profit driver. If a deal with Iran materializes and Iranian oil returns to the market (even partially), Brent could fall to $75-80, cutting oil majors' profits by 15-20% next quarter.
Defense contractors (Lockheed Martin, RTX): Lockheed Martin fell 4.1% on Thursday, despite the Middle East conflict not being over. The market is pricing in reduced US military orders if escalation stops. Stocks of companies producing air defense systems and drones—exactly what the US actively used against Iran—were hit hardest.
Traders who bought safe-haven assets on escalation: Short positions on stocks, long on oil, long on VIX—all these positions were closed at a loss on Thursday. Estimated losses for speculators betting on continued conflict are $8-10 billion in one day.
Canadian stock market (S&P/TSX): Paradoxically, the Canadian index rose only 1.52% versus 1.8% in the US, even though Canada is a major oil exporter and should have benefited from high prices. The reason: the Canadian market is overweight energy and commodity stocks, which suffered from falling oil. The materials sector (mining) rose, but that didn't offset oil losses.
What the Media Isn't Saying
Insight #1: There's effectively no deal, and Trump has said a "deal is close" 50 times before.
This is the most important and most hidden fact. President Trump has repeatedly stated since the conflict began (February 28, 2026) that a deal with Iran is "close," but it has never materialized. Iran has repeatedly accused the US of sabotaging negotiations with "illegal demands." Even on June 11, after Trump's announcement, the Iranian agency Fars issued a direct denial. Moreover, Fox News reported that US forces shot down two Iranian kamikaze drones attacking commercial vessels in the Strait of Hormuz after the "deal" was announced.
What conclusion can we draw? The market bought not a real peace, but a desire for peace. Traders trapped in short positions used Trump's statement as an excuse for mass covering, regardless of its veracity. This is a classic "buy the rumor" at maximum speed. And as soon as it becomes clear that the weekend signing didn't happen (70-80% probability), the market will correct as quickly as it rose.
Insight #2: AI is a hidden beneficiary, but it also creates fragility.
Why did the NASDAQ rise 2.5% while the Dow only rose 1.9%? Because falling bond yields most strongly impact long-duration assets, and AI companies (NVIDIA, AMD, Broadcom) have the longest future cash flows. But there's a catch: AI stocks are at levels that imply a perfect scenario—Fed rate cuts, 40% annual growth in corporate AI spending, and no geopolitical shocks.
This rally made AI stocks even more overheated. NVIDIA's P/E ratio rose to 68 (versus 45 for the S&P 500), and its stock volatility over the past week was 85% annualized. Any failure in Iran negotiations or a new round of escalation will hit the NASDAQ 2-3 times harder than the Dow. The market has become more vulnerable, not less.
Insight #3: The Strait of Hormuz blockade remains in place despite the "deal."
Even according to Trump's own statements, the naval blockade of Iranian ports will remain until the official signing of the agreement. Moreover, mines laid by Iran and US forces remain in the Strait of Hormuz, and clearing them will take weeks. Iranian oil fields, closed for four months of conflict, will require months to resume production.
So even if Trump and Iran's Supreme Leader sign a Memorandum of Understanding (MoU) tomorrow, actual Iranian oil supplies to the market won't begin before September-October 2026. Until then, Brent will stay above $85 simply due to physical shortages. Yet the market is behaving as if Iranian oil will flood the market next week. This is a pricing error that smart money is already using to buy oil calls.
Forecast: Next 30 Days and 90 Days
Next 72 hours (through June 15, 2026, weekend and Monday):
S&P 500: Correction of 0.5-1.0% from Thursday's levels if the deal isn't signed over the weekend. If Trump announces a signing (20-25% probability), a new surge to 7,450. Key levels: support 7,300, resistance 7,420.
Brent Crude: Return to $90-92 by Monday if the deal isn't signed. Too many physical constraints to keep prices below $89.
NASDAQ: High volatility in pre-market hours on Monday. Reaction to negotiation news will be instantaneous. Expect a gap open of +/- 1.5%.
Next 30 days (through July 12):
US Stock Market: S&P 500 range 7,200 – 7,500. Geopolitical factors will dominate economic ones. Each new Trump tweet about Iran will move the market 0.5-1.0%. Funds will reduce risk, increasing cash holdings to 5-7% (currently 3.5%).
Oil (Brent): Range $85 – $95. Even with a partial reopening of the Strait of Hormuz, it will take time to restore production. OPEC forecasts 2026 demand growth of only 1 million barrels per day, limiting upside potential.
Airline stocks: Will continue to rise if oil stays below $90. Best candidates: Delta, United, American Airlines. Risk: Atlantic hurricane season (July-August) could push oil up again.
10-Year Treasury Yield: Will remain in the 4.40-4.60% range. PPI at 6.5% makes a Fed rate cut impossible until November 2026, limiting yield declines.
Next 90 days (through September 12):
Main scenario (60% probability): The US-Iran deal is never signed in final form; the Strait of Hormuz remains partially blocked. S&P 500 corrects to 7,100-7,200; oil returns to $90-95.
Alternative scenario (25% probability): A Memorandum of Understanding is signed within 30 days; the Strait of Hormuz reopens by September. Brent falls to $75-80; S&P 500 rises to 7,600-7,700. Airline and cruise stocks rise 20-30%.
Risk scenario (15% probability): Escalation resumes after failed negotiations; Iran attacks US bases in the region. Brent surges to $120-130; S&P 500 falls 8-10% to 6,700-6,800.
Best hedging asset for 90 days: Call options on VIX with a strike of 25 and September expiration. Cost of such a hedge: about 2-3% of portfolio. In the risk scenario, it would pay off 5-7 times.
Editorial Forecast
Asset: S&P 500 Direction: Sideways with elevated volatility amid conflicting signals on the Iran deal, then likely a 0.5-1.0% correction on Monday if the agreement isn't signed over the weekend. Key levels: Support — 7,300 (50-day moving average), 7,250. Resistance — 7,420 (Thursday's peak), 7,450 (psychological level). Confidence level: Medium (55%). The outcome of negotiations is unpredictable, and the market's reaction to Iran's denials was anomalously weak, indicating a "bubble" sentiment. Main risk to forecast: Official announcement of a US-Iran agreement signing on Sunday evening (June 14). In that case, the S&P 500 would open with a gap up of 1.5-2.0% on Monday, breaking above 7,500, and oil would crash to $82-84 for Brent. Probability: 20-25%, but stakes are very high.
The editorial opinion is not an investment recommendation. All trading decisions are made at your own risk.
— Editorial Team