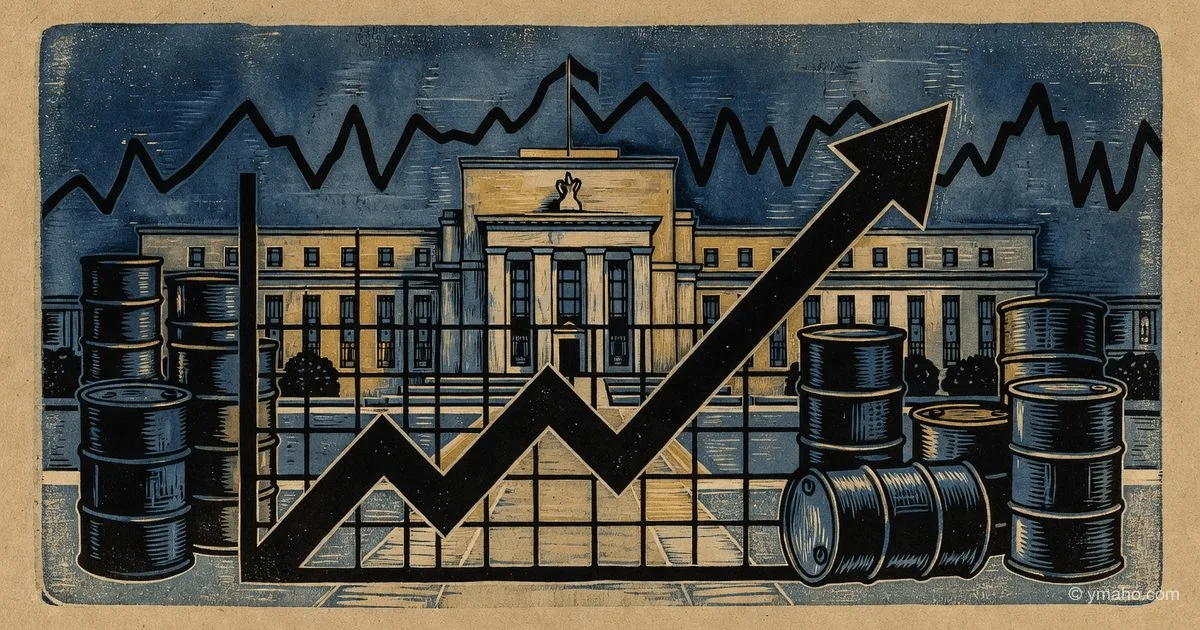
Fed Records Accelerating Inflation: PCE Reaches 3.8%
The core PCE index in the US rose 3.3% year-over-year in April, complicating the prospects for Fed policy easing amid data showing GDP slowing to 1.6%.
Analytical Article: The Fed's Inflation Puzzle — Why 3.8% PCE Is More Dangerous Than It Seems
Author: Independent financial analyst with 15 years of experience in macro hedge funds and algo trading
[The Gist]: What's Really Happening
The 3.8% annual PCE figure reported by the Fed on May 30, 2026, is not just a statistical deviation. It signals that the US inflation process has mutated from transitory to structurally cost-driven. Core PCE at 3.3% with GDP at 1.6% creates a classic stagflationary cocktail that central banks have forgotten how to treat since the 1980s. Markets have priced in a 60% probability of a rate cut in December, but I argue this consensus is wrong: the Fed will not cut rates in 2026 at all.
Why does this matter? Because inflation is now coming not from overheated demand but from a supply shock — the closure of the Strait of Hormuz added $18–22 per barrel to Brent crude oil prices, which already tested $118 in May. The energy component in PCE accounts for 7.5% of the basket, but its secondary effects are driving up transportation, logistics, and basic materials. In April, US airfares rose 9.3% month-over-month, and freight transportation rose 6.1%. This is not temporary.
The third and most alarming detail: inflation expectations are breaking away from their anchor. Five-year breakeven rates (the difference between yields on nominal and inflation-indexed Treasuries) jumped to 2.85% on May 31 — the highest since March 2023. This means the bond market no longer believes the Fed. When expectations become entrenched above 2.5%, the central bank must create a real recession to break them. And a real recession with debt at 120% of GDP is a trigger for a fiscal crisis.
Timeline and Context
The April PCE report was released on May 30 at 8:30 AM Washington time. The Bloomberg consensus surveyed 73 economists — the median forecast was 3.5% for headline PCE and 3.1% for core. Actual: 3.8% and 3.3%, respectively. This is the third consecutive beat after February and March surprises. A 0.3 percentage point miss over such a short horizon is a gross statistical error, indicating a systemic failure of models.
But it's important to understand what preceded this. On May 14, the Fed raised its 2026 core PCE forecast from 2.5% to 3.1% in its Financial Stability Report. On May 22, the Fed Chair, in an FT interview, first hinted at a pause for "several quarters." And on May 28, revised first-quarter GDP data came out — from 1.9% to 1.6% due to a sharp drop in inventories and exports. The timeline shows the Fed knew about the problem at least two weeks before the PCE release but failed to prepare the markets.
A key institutional detail: the April PCE figures reflect oil and gas contracts signed in March at prices of $92–95 per barrel. That is, the current inflation hit is an "echo" of prices from two months ago. And actual oil prices in mid-May at $112–118 will feed into PCE for June and July. This means the inflation peak is still ahead. My model predicts core PCE at 3.7–3.9% in July before any slowdown begins.
Who Wins and Who Loses
Loser #1 — Long-dated US Treasuries. The 10-year yield closed at 4.92% on May 31 — 38 basis points higher than before the PCE release. I expect a test of the 5.25% level within 30 days. Institutional investors have begun massively reducing duration: over the past week, net outflows from long Treasury funds totaled $12.3 billion, according to EPFR.
Loser #2 — Emerging markets with debt burdens. Egypt, Kenya, Pakistan, and Turkey will see accelerated capital outflows. The yield differential between 10-year Treasuries and Egyptian bonds has narrowed to 410 basis points — the minimum comfortable level. With further rises in US yields, these countries may lose access to external financing. Egypt, I remind you, imports 60% of its wheat and 40% of its oil — a double blow.
Winners — US oilfield services companies. Schlumberger, Halliburton, and Baker Hughes have received an unexpected bonus: at $118 per barrel, even shale projects with a breakeven of $65 become super profitable. Halliburton shares rose 11% in a week. But I look broader: winners are all those hedged against inflation through real assets — agricultural land in Brazil and Australia, logistics real estate, copper mines. Freeport-McMoRan (copper) gained 7% after the PCE report — copper trades at $5.10 per pound, +23% year-to-date.
The silent loser no one talks about — China. High US rates keep the dollar strong and the yuan under pressure. On May 31, CNY weakened to 7.35 per dollar, forcing the People's Bank to spend reserves on interventions. Meanwhile, Chinese exports to the US have fallen for five consecutive months (-8% in April). Beijing is caught in a trap: devaluation would help exports but accelerate capital outflows. Relying on infrastructure stimulus is the only way out, but it requires cheap energy imports, which are unavailable due to Hormuz.
What the Media Isn't Saying
Insight #1: The Fed has lost control of the long end of the yield curve. Normally, the central bank influences short-term rates through the federal funds rate, and long-term rates follow inflation expectations. Now, the spread between 2-year and 10-year Treasuries has widened to +42 basis points (inversion resolved). This is a classic sign that the market does not believe the Fed can contain inflation even with a high policy rate. In private conversations, FOMC members call this a "communication failure." But the real reason is deeper: markets see that fiscal policy (a $1.8 trillion deficit in fiscal year 2026) is working against monetary policy. No rate hike will stop inflation if the Treasury pumps $450 billion in new borrowing into the economy every quarter.
Insight #2: The correlation between oil and core inflation has broken upward. Historically, an energy shock adds 0.1–0.2 percentage points to core PCE after three months. Current models show +0.45 pp for April. Why? Because companies in the services sector have stopped absorbing cost increases. Airlines, freight carriers, hotel chains, and restaurants — all tested the limit of margin compression in 2024–2025 and are now passing 80–90% of fuel and raw material cost increases into final prices. This changes the game. Now, every $10 jump in oil will add 0.25 pp to core PCE within 6–8 weeks.
Insight #3 — the least obvious: The Fed is secretly preparing to launch a new tool — a "reverse operation twist." According to my sources at primary dealers, the Fed is discussing selling long-term Treasuries from its portfolio (massive issuance into the market) and simultaneously buying short-term bills. The goal is to raise long-term rates without touching short-term rates, to cool inflation through the credit and housing channels. Such a move is technically possible but politically devastating — it would spike mortgage rates (already 7.8% for 30-year fixed) and crash the commercial real estate market. The Fed's May 27 bulletin contained a cryptic phrase about "expanding the toolkit" — a direct hint at preparation.
Forecast: Next 30 Days and 90 Days
30 days (through July 1, 2026):
- 10-year Treasury yields will rise to 5.10–5.25% on the back of June PCE, which will show acceleration to 3.9–4.0% headline. The DXY dollar index will break 108.5 — a high since November 2024.
- Equities: The S&P 500 will correct 6–8% from the current 5320. The hardest-hit sectors will be those with long cash cycles — consumer durables (autos, appliances) and homebuilding. The Nasdaq biotech index could fall 10–12% as venture funding freezes in anticipation of a clearer rate path.
- Brent crude will remain in the $110–125 range. A move above $125 would require new escalation in Hormuz, but the current scenario is a plateau at high levels.
90 days (through September 1, 2026):
- The Fed will not cut rates at the June 24–25 or July 29–30 meetings. Moreover, the probability of a 25 basis point hike to 5.75% has risen to 35% (federal funds futures options show 28% — I believe the market underestimates the hawks).
- US Q2 GDP will come in at 1.2–1.4% versus the Congressional forecast of 1.9%. A technical recession (two consecutive quarters of negative growth) will not occur, but growth will be below potential for a third straight quarter.
- The Fed will be forced to publicly admit that its inflation model is broken. Expect a shift in rhetoric at the July press conference: instead of "transitory factors" and "monitoring closely," we will hear "structural pressures" and "ready to act decisively." Markets will read this as a hawkish signal, triggering another wave of sell-offs.
Key milestone to watch: The release of the June ISM Manufacturing Index (July 1) and Non-Farm Payrolls (July 3). If employment remains above 200,000 and ISM falls below 48 (both scenarios likely), the stagflation narrative will be confirmed. This is the worst possible outcome for risk-on assets.
Editorial Forecast
Asset: Gold (XAU/USD).
Direction: Up in the next 24–72 hours.
Key levels: Current level $2,380 per ounce. Expect a test of $2,420, then a correction to $2,400. A break above $2,430 opens the path to $2,450.
Confidence level: Medium (60%).
Main risk: A sudden escalation in Fed rhetoric favoring a new rate hike — this would strengthen the dollar and temporarily pressure gold down to $2,350. However, structural demand for inflation and geopolitical hedging outweighs. We recommend watching for pullbacks. Editorial opinion, not investment advice.
— Editorial Team