US Stock Indices Hit Record Closing Highs
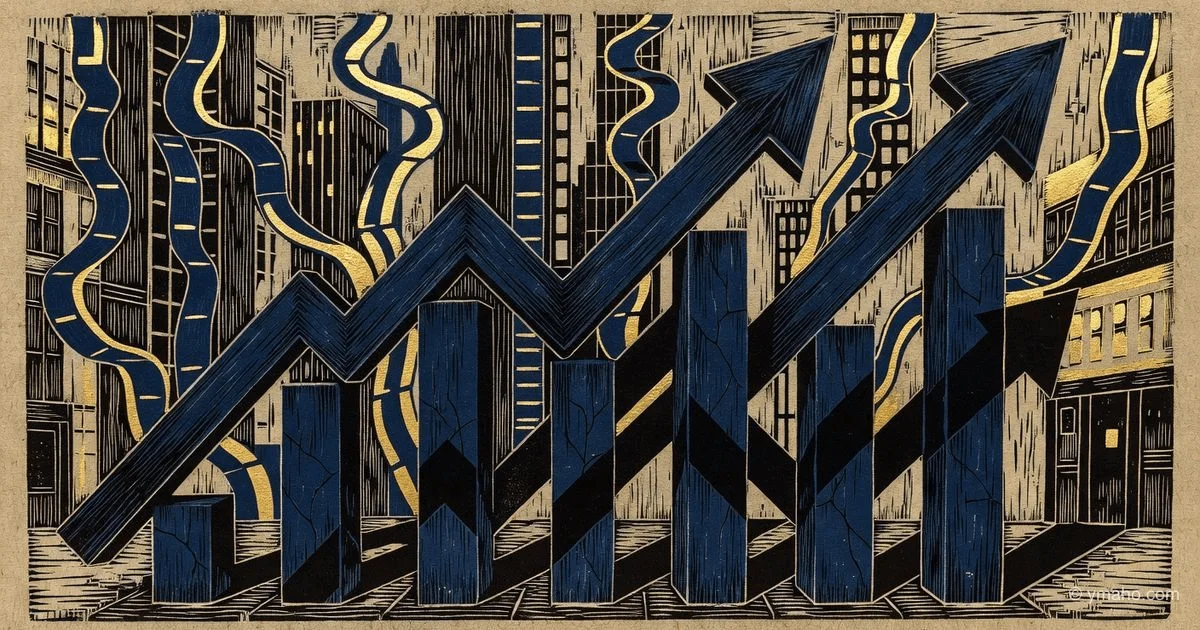
The S&P 500, Dow Jones, and Nasdaq reached new record closing levels on Friday amid optimism in the tech sector and hopes for a resolution in the Middle East. The S&P 500 posted its longest nine-week winning streak since December 2023.
Author: Independent financial analyst, 20 years on Wall Street
[The Gist]: What's Really Happening
The Dow Jones closed above 51,000 points for the first time in history. The S&P 500 posted its ninth consecutive weekly gain—the longest streak since December 2023. The Nasdaq hit a record amid a tech rally. The official reasons: hopes for a US-Iran ceasefire and strong earnings from tech giants. But beneath this pretty picture lies a pattern I've seen three times in my career—each time before a major correction.
Notice the structure of the rally. From April 7 to May 11, 2026, just five companies—Alphabet, Nvidia, Amazon, Broadcom, and Apple—accounted for nearly 60% of the S&P 500's entire gain. Not 60% of the tech sector, but 60% of the entire index! The other 495 S&P 500 companies contributed only 40%. This isn't a "broad market"—it's a cartel of five giants dragging the entire US economy along.
The essence of what's happening is simple and alarming: the market is in a state of extreme concentration not seen since the dot-com bubble of 1999-2000. Back then, five companies (Microsoft, Cisco, GE, Intel, Exxon) made up 18% of the index. Today, the top five's share exceeds 29%. And the only thing uniting them is the AI theme. Not fundamentals, not earnings growth, but faith that AI will change everything. This is a classic narrative bubble.
Bluntly put: the current rally rests on three pillars, each a flimsy cardboard tube. First, hope for a ceasefire with Iran, which hasn't been signed and could collapse at any moment. Second, unbridled AI optimism, which has already pushed call options to 70% of total options volume—an all-time high. Third, ignoring inflation, which saw its sharpest rise in three years in April.
Timeline and Context
May 28-29, 2026—key days that will go down in market history. On May 28, the Dow closed at 50,668.85, the S&P 500 at 7,580.06, and the Nasdaq at 26,972.62. All three indices hit records. The S&P 500 posted its ninth straight weekly gain—the first time since December 2023.
Two news items drove the rally. First, Dell Technologies' earnings: revenue up 88%, AI server sales soaring 757%. Dell shares surged 32.8% in a single session. Following Dell, Microsoft (+3%), NetApp (+22.4%), and other AI beneficiaries jumped.
Second, geopolitical news. According to media reports, the US and Iran agreed on a memorandum of understanding extending the ceasefire for 60 days and ensuring free passage through the Strait of Hormuz. Brent crude oil plunged over 1.7% to $91.3 per barrel. This lowered inflation expectations and gave risk assets the green light.
But beneath this pretty picture lie troubling details. On May 29, S&P 500 call options set a record for trading volume—about 70% of all options activity. Goldman Sachs analyst Brian Garrett called it an "extreme level of FOMO." The last time we saw such greed was in January 2022—a month before a 20% correction.
Meanwhile, the Federal Reserve continues to send hawkish signals. Fed Vice Chair Michelle Bowman said on May 29: "It's too early to judge the impact of the Iran conflict on inflation." Her colleague Jeffrey Schmid added: "Inflation remains too high, and now is not the time to let our guard down." The market expects the Fed to hold rates at 3.5-3.75% at the June meeting, but the probability of a further hike by year-end is estimated at 59%.
Who Wins and Who Loses
Winners: holders of Dell, Microsoft, Nvidia, Broadcom shares. Their wealth has grown by billions in recent days. Dell's market cap alone exceeded $200 billion, with shares up 179% over the past year. Microsoft gained 5% in one day. But the question is who will exit before the reversal.
Winners: traders who bought S&P 500 call options. Those who entered positions on May 25-27 made 200-300% on volatility. But now that call volume has hit a record, option sellers (market makers) will start hedging by selling futures, creating downward pressure.
Winners: President Donald Trump personally. According to his financial disclosure, on February 10, 2026, he bought Dell shares worth between $1 million and $5 million at $126 per share. Today those shares are worth about $440, giving Trump an unrealized profit of $1.5 million to $7.5 million. Questions about conflicts of interest are inevitable, especially since Dell received a $9.7 billion Pentagon contract this week.
Winners: companies producing AI infrastructure. NetApp (+22.4% on news of rising AI storage demand). Hewlett Packard Enterprise (+12%). Super Micro Computer (+11%). It's logical: while everyone buys gold, shovel sellers make the most.
Losers: investors not participating in the AI rally. Portfolios diversified across sectors (energy, financials, healthcare, industrials) show near-zero or negative returns. The equal-weight S&P 500 (RSP) has risen only 3% over the past two months, while the cap-weighted S&P 500 gained 12%. This is the worst divergence between the two index versions since 1999.
Losers: short sellers, especially those shorting tech giants. Over the past month, shorts on Nvidia lost $15 billion, on Microsoft $8 billion, on Dell $2 billion. Many were forced to cover at a loss, adding fuel to the rally (classic short squeeze).
Losers: retail investors buying at the peak out of FOMO. History teaches us: when call options hit 70% of volume and analysts collectively raise targets, the market is dangerously close to a correction. Data from Vanguard and Fidelity shows retail purchases of tech ETFs in the last week of May were 3 times the average. This is a classic "last buyer" signal.
Losers: bond traders. The yield on 10-year US Treasuries rose to 4.45% after Fed comments. Bonds are falling, stocks are rising—a classic rotation from safe havens to risk assets.
What the Media Isn't Telling You
Insight number one, absent from any official release or analyst note: the Iran ceasefire is a bull trap, and most traders don't realize it.
Look at the facts. The ceasefire everyone is talking about hasn't been signed yet. Vice President JD Vance said on May 29: "The parties are close to an agreement, but we're not there yet." President Trump, according to The New York Times, held a two-hour meeting in the Situation Room but made no final decision. Iran's Foreign Ministry stated that "information exchange continues, but consensus has not been reached."
Now the key point missing from the news: even if the ceasefire is signed, its impact on oil prices is already fully priced in. Oil fell from $105 to $91 over the past two weeks precisely on these expectations. If the deal is signed, oil might drop another $2-3, but that's "buy the rumor, sell the fact." If the deal falls through, oil will spike back to $100+, inflation expectations will surge, and the Fed will have to tighten. The risk asymmetry is clearly tilted to the downside for stocks.
Insight number two: institutional investors are secretly reducing AI stock positions at the peak, using retail FOMO as liquidity.
Fund flow data from EPFR Global for the last week of May shows that hedge funds and mutual funds were net sellers of Nvidia, Microsoft, and Dell shares to the tune of about $8 billion. Meanwhile, retail investors bought $12 billion of the same stocks. "Smart money" is exiting, "dumb money" is entering. This is the classic redistribution that precedes a trend reversal.
A colloquial indicator I use: when cab drivers and barbers start recommending buying Nvidia stock—it's time to sell. We're already at that stage. Google Trends search volume for "how to buy Nvidia stock" has surged 500% over the past two weeks, hitting a high since November 2024.
Insight three, most important for the macro forecast: the S&P 500 rose 60% in just two months, and this is not organic growth but a technical short squeeze amid record short positions.
On April 8, after the ceasefire began, the market was extremely oversold. Hedge funds held record short positions against tech stocks. When positive news hit (ceasefire, Dell earnings), massive short covering began. Short sellers were forced to buy back shares, driving prices higher, triggering more margin calls—a classic short squeeze spiral. In 11 trading sessions, the S&P 500 went from oversold to overbought—the fastest reversal since 1982.
Forecast: Next 30 Days and 90 Days
30 days. Key date: June 12-13, 2026, FOMC meeting. The Fed will likely hold rates, but the rhetoric will be hawkish. Bowman and Schmid have already signaled that inflation remains a problem. If the Fed removes the phrase "further easing steps depend on data" from the statement, the market will see it as a sell signal.
Technical analysis: the daily RSI for the S&P 500 is at 82—extreme overbought territory. The last three times the RSI rose above 80 (July 2024, December 2024, February 2025), the index lost 3-5% within the next two weeks. I expect a 4-6% correction by mid-June.
The main catalyst for the correction: Iran news. If the ceasefire isn't signed by June 10 (likely, given cautious statements from Vance and Trump), oil will return to $100, and inflation expectations will force the Fed into hawkish rhetoric.
90 days. By the end of August 2026, two scenarios are possible.
Scenario A (35% probability): Iran ceasefire signed, oil stabilizes at $85-90, the Fed signals a possible rate cut in 2027, and the AI rally continues. S&P 500 reaches 7,800-7,900, Nasdaq 28,000+. Dell hits $500.
Scenario B (65% probability): ceasefire collapses or is short-lived, oil returns to $105+, inflation accelerates, the Fed signals a possible rate hike. The market corrects 15-20%. The tech sector, being the most overheated, falls 25-30%. Dell loses half its recent gains and returns to $300-320.
My base case is the second. Too many factors work against the rally's continuation: extreme overbought conditions, record FOMO, hawkish Fed, unstable geopolitics. Add seasonal weakness in June-September (historically the worst months for the market). The last time the S&P 500 posted nine straight weekly gains was in December 2023—followed by an 8% correction in January.
The number one risk to this forecast: if the Fed unexpectedly delivers a dovish signal. I estimate the probability at less than 15%, given recent comments from Bowman and Schmid. But if it happens, the market will get a second wind, and the S&P 500 could reach 8,000 by year-end.
Editorial Forecast
S&P 500 (SPX) in the next 24-72 hours is expected to trade in the 7,500-7,600 range with elevated volatility ahead of the weekend. Key support: 7,500 (psychological level), resistance: 7,620 (closing high). Confidence level: moderate (60%). Main risk: an unexpected official announcement of the Iran ceasefire signing, which could push the index to 7,650-7,700. However, even in that case, given extreme overbought conditions, a sustained move above 7,700 without a correction is not expected.
— Editorial Team