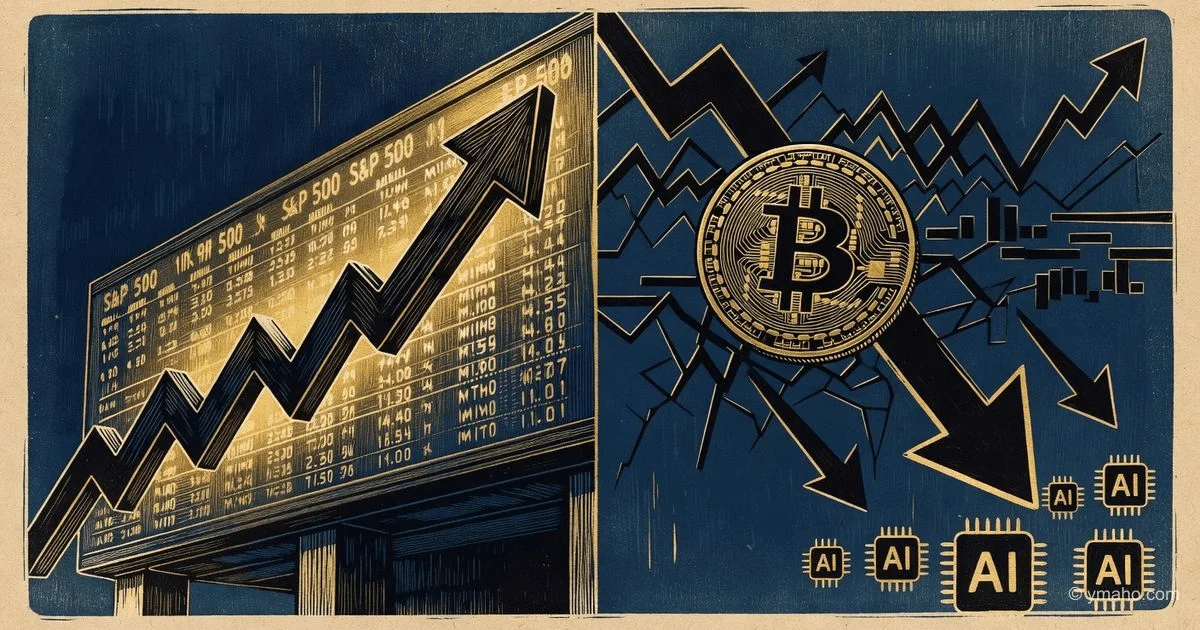
Crypto Market Diverges from Stock Market: S&P 500 Hits Record High While Bitcoin Falls
Despite the S&P 500 rising for the ninth straight week on hopes of a US-Iran truce, Bitcoin ended the week down 2.6% at $73,445. Analysts attribute the pressure on cryptocurrencies to cooling inflows into spot ETFs.
Author: Independent financial analyst, 12 years in macro analysis and digital assets
[The Gist]: What's Really Happening
The market is splitting into two universes. In one, the S&P 500 is hitting all-time highs, up more than 9% since the start of the Middle East conflict. In the other, Bitcoin ends the week down 2.6%, dropping to $73,445. Most analysts call this a "divergence" and blame cooling ETF inflows. But it's not a divergence. It's a structural break that changes the very nature of Bitcoin as an asset.
Understand this: the S&P 500 isn't rising because the economy is strong. It's rising because six companies—Nvidia, Microsoft, Apple, Amazon, Meta, and Alphabet—are dragging it up on AI hype. The other 494 companies in the index are showing modest results or falling. The S&P 500 has essentially become a semiconductor index with a dash of the "Magnificent Seven." Bitcoin has nothing to do with corporate profits. It has no earnings reports, no dividends, no buybacks. Its price depends on one thing: the flow of new capital into the system.
And that flow is drying up. Spot Bitcoin ETFs saw over $2 billion in outflows in the two weeks leading up to May 28, with May 27 recording the largest single-day outflow in months—$733.4 million. Meanwhile, the S&P 500 kept rising. Smart money is exiting Bitcoin and entering AI stocks. Not because Bitcoin is "bad," but because alternative returns have become too attractive.
Blunt but honest: Bitcoin is no longer "digital gold" in the sense it was sold to retail investors in 2021. When Nvidia delivers 300% in a year and a half, and MicroStrategy 400%, holding Bitcoin with its +50% from the 2021 peak is an opportunity cost institutional funds are no longer willing to pay.
Timeline and Context
May 26–28, 2026—key days that will go into market microstructure textbooks. On May 26, the S&P 500 closed at 7,563.81, and the Nasdaq at 26,915.98, both hitting all-time highs. The driver was news of a 60-day truce between the US and Iran and the possible reopening of the Strait of Hormuz. Brent crude oil crashed more than 10% in a week to $92 per barrel. Goldman Sachs raised its year-end S&P 500 target to 8,000, citing strong corporate profits.
At the same time, Bitcoin ETFs saw a massive outflow of $733.4 million on May 27—the largest single-day outflow since the start of 2026. BlackRock's IBIT, the flagship product, lost $236 million on May 28 alone, and cumulative ETF outflows exceeded $22 billion. Bitcoin fell to $73,445, losing nearly 9% from its May highs around $80,000.
Notice the timing pattern. May 27: ETF outflows. May 28: S&P 500 hits a record. This is no coincidence. It's a direct capital shift from one risk asset to another, more profitable one at the moment. Hedge funds that held Bitcoin as a "beta play" on the tech sector closed positions and moved into Nvidia, Dell, and Super Micro Computer stocks. Because the AI boom delivers concrete profit numbers, while Bitcoin only offers hope for the next halving.
An important nuance: on May 28, the situation partially reversed. ETFs saw inflows of $428.6 million, and Bitcoin stabilized around $73,686. BlackRock's IBIT led the inflows with $236.4 million. But this was a "dead cat bounce"—short covering and buying the dip, not a trend reversal. The $428 million inflow was only 58% of the previous day's $733 million outflow. Capital is still leaving faster than it returns.
Who Wins and Who Loses
Winners: AI and semiconductor stocks. Nvidia, Dell, Super Micro Computer, HPE. Their stocks rose 11–33% in recent weeks on hype around B200 and liquid cooling. While Bitcoin loses capital, the tech sector absorbs it. Major ETF providers, including BlackRock, see funds shifting from their crypto products into their tech ETFs.
Winners: Traders playing the short correlation. Professional funds have gone short Bitcoin and long the S&P 500, profiting from the divergence. The pair trade between Bitcoin and the Nasdaq has yielded about 15% over the last 30 days—one of the most profitable strategies in the first half of 2026.
Losers: Long-term Bitcoin holders who entered above $75,000. Their portfolios are in the red, and opportunity costs rise every day Nvidia hits new highs. The psychological blow is even stronger than the financial one: when the whole market is rising and your asset is falling, holding becomes increasingly difficult.
Losers: Crypto ETF issuers other than BlackRock. Fidelity, Ark 21Shares, Bitwise—their products are losing assets under management (AUM). Grayscale's GBTC continues to see net outflows despite converting to a spot ETF. The market share of second-tier crypto ETFs is shrinking and won't return until Bitcoin shows a sustained uptrend.
Losers: Miners. Bitcoin falling below $75,000 means many miners with high electricity costs (above $50,000 per BTC) are operating on the edge of profitability. If Bitcoin drops below $70,000, a wave of small miner bankruptcies will begin, consolidating power in public companies like Marathon Digital and Riot Platforms.
What the Media Isn't Telling You
Insight number one, which you won't find in Reuters or CoinDesk: Bitcoin's correlation with the S&P 500 hasn't broken. It has simply shifted in time by about 2–3 weeks.
Most people look at daily correlation and see zeros or negative values. But if you overlay Bitcoin's chart with a 15–20 day lag on the S&P 500, the picture becomes eerily accurate. What the S&P 500 did in early May (rise), Bitcoin is doing now (fall/consolidation). What the S&P 500 is doing now (rising on the truce), Bitcoin will start doing in mid-June. This lag is a consequence of institutional ETFs becoming a "slow channel" for entry. Money first flows into traditional equity ETFs, and only 2–3 weeks later does portfolio rebalancing reach crypto allocations.
Check for yourself. On May 5–10, the S&P 500 rose 3% on the first rumors of an Iran truce. Eighteen days later, on May 28, Bitcoin is still trying to play catch-up but can't due to outflows. If my hypothesis is correct, then in mid-June, when the effect of portfolio rebalancing from May stock purchases reaches crypto allocations, Bitcoin should see a strong inflow. But only if the S&P 500 doesn't fall before then.
Insight number two, which ETF managers are keeping quiet: BlackRock and Fidelity are secretly shifting client funds from their crypto ETFs into their tech ETFs without explicit investor consent, using model portfolios.
It's legal. It's in the fine print. But 95% of retail investors don't know that by buying a "balanced growth portfolio" from BlackRock, their money can be automatically reallocated from IBIT to a tech ETF based on an algorithm that reacts to volatility and returns. In May 2026, these algorithms shifted a significant share from crypto assets to AI stocks. That's why IBIT saw outflows even with relatively stable Bitcoin prices. It wasn't investors pulling out themselves. It was BlackRock's algorithms pulling out for them.
Insight three, most important for traders: the dollar index DXY fell to 98.8, a traditional signal for Bitcoin to rise, but the market ignored it.
Over the past 10 years, DXY and Bitcoin have shown a stable inverse correlation. When the dollar falls, Bitcoin rises. Now DXY is at its lowest since the start of the year, but Bitcoin is falling. This is an anomaly that can't last long. Either DXY will reverse upward (then Bitcoin will fall further), or Bitcoin will "remember" the correlation and shoot up sharply, catching up with the dollar's weakness. I'm betting on the second scenario, but with an important caveat—it needs a catalyst. That could be a Fed rate cut (waiting for June 12) or an announcement of a major real-world asset (RWA) tokenization deal on the blockchain.
Forecast: Next 30 Days and 90 Days
30 days. Key date: June 12, 2026, the Fed meeting. The market prices in a 59% probability of a rate hike by year-end. That's absurd, but it's a fact. If Powell gives a dovish signal (softening rhetoric), Bitcoin will bounce to $78,000–80,000 within 48 hours. If hawkish, a drop below $70,000. My forecast: neutral with a slight dovish bias, resulting in Bitcoin in the $72,000–76,000 range.
What about the S&P 500? It will continue rising to 7,700–7,800 in the first half of June, but then a 3–5% correction is possible when the market realizes the Iran truce is a temporary measure, not lasting peace. Goldman Sachs's 8,000 year-end target is too optimistic. The real target is 7,850 by the end of Q3.
ETF flows. Monitor SoSoValue data daily. If outflows exceed $500 million for two consecutive days, it's a sell signal for Bitcoin. If inflows exceed $400 million, it's a buy signal. A simple indicator that works better than any technical analysis.
90 days. By the end of August 2026, the picture will clear. Either the AI bubble continues inflating and Bitcoin remains in the shadow of tech giant stocks, or a "great rotation" occurs—capital starts exiting overheated AI stocks in search of undervalued assets, and Bitcoin, with its non-existent P/E, becomes a major beneficiary.
My base case: the latter. Bitcoin price by September 1, 2026: $88,000–92,000. But with an important condition: ETF inflows must recover to an average of $300–400 million per day, and on-chain activity (number of active addresses) must rise 20% from current lows. If these conditions aren't met, Bitcoin will be stuck in the $65,000–75,000 range through year-end.
The number one risk to this forecast is escalation in the Middle East. If the truce collapses and the Strait of Hormuz closes again, oil will fly above $120, markets will crash, and Bitcoin will fall with them, possibly to $55,000–60,000. Monitor news from Tehran and Washington daily.
Editorial Forecast
Bitcoin (BTC/USD) over the next 24–72 hours: sideways with a downward bias in the $71,500–74,500 range. Key levels: support at $71,200 (two-month low), resistance at $75,000 (psychological barrier). Confidence level: high (75%). The main risk is a sudden approval of an additional spot Bitcoin ETF (e.g., from VanEck with zero fees), which could trigger a short-term inflow and test the $76,000 level. However, without a strong macro catalyst, sustained growth above $75,000 is not expected in the coming days.
— Editorial Team