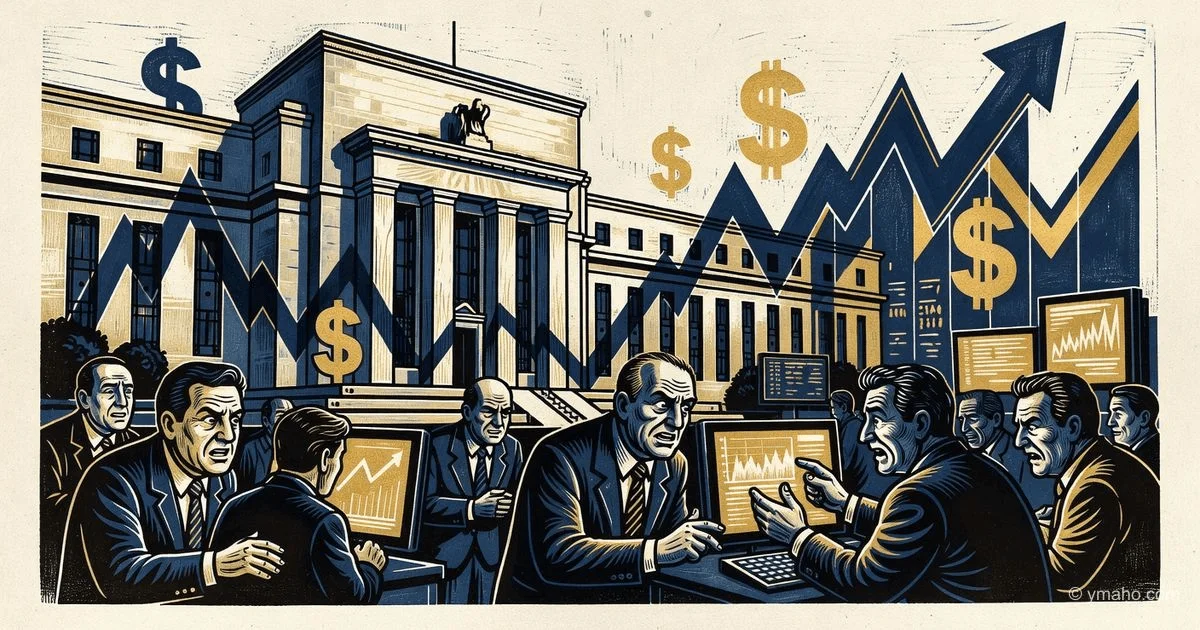
Investors Brace for US Labor Market Data to Gauge Fed Rate Path
In the coming week, market attention will be on the US nonfarm payrolls report for May. Current LSEG market data puts the probability of a Fed rate hike by year-end at 59%.
Author: Independent financial analyst, 15 years in macroeconomics and trading
[The Gist]: What's Really Happening
The market is in a holding pattern. The US nonfarm payrolls report for May is the main event this week. Formally, it's just another routine data release. Informally, it's a moment of truth for the entire market structure built over the past two months. How many jobs the US economy created in May will determine whether the Fed raises rates by year-end. And that, in turn, will decide the fate of stocks, the dollar, bonds, and indirectly, the crypto market.
Pay attention to the numbers. The consensus forecast is around +89-93 thousand new jobs. The April figure was revised up to +115 thousand. The unemployment rate is expected to stay at 4.3% for the third consecutive month. But these averages hide two extremes, each capable of crashing the market.
The essence of what's happening is simple and troubling: the market is extremely sensitive to data. LSEG puts the probability of a Fed rate hike by year-end at 59%. As recently as March, the market was pricing in a cut. In two months, there has been a complete 180-degree reversal. The reason is April inflation, which accelerated to 3.8% year-over-year. Now every new labor market indicator will be interpreted through the lens of inflation: a strong labor market = additional inflationary pressure = rate hike. A weak labor market = recession risk = also a decline.
Bluntly but honestly: the market is caught between the Scylla of inflation and the Charybdis of recession. Any deviation from consensus in either direction will trigger a sell-off. The paradox is that the "ideal" scenario—data exactly in line with consensus—is unlikely. And even that doesn't guarantee calm, because the internal structure of the report could hold surprises.
Timeline and Context
May 2026 was a turning point for market expectations. On May 12, April CPI data came in at 3.8% year-over-year, up from 3.3% in March. That was a shock. The market, which in April was still pricing in Fed easing in the second half of the year, switched within days to a rate hike scenario. By May 19, the probability of a December hike exceeded 50%. By the end of the month, it reached 59%.
This reversal had a clear cause—an energy shock. The conflict in the Middle East and a partial blockade of the Strait of Hormuz pushed oil prices above $100 per barrel. Gasoline at US pumps rose from $3.14 to $4.50 per gallon. Transportation costs, food prices, production expenses—everything went up. This is a classic supply shock, and the Fed cannot ignore it.
Now for the coming week. The calendar is packed: Tuesday—JOLTS report on job openings for April. Consensus is around 6.8 million. Wednesday—ADP private payrolls for May (forecast +118 thousand) and ISM Services (forecast 54.4). Friday—the main event: Nonfarm Payrolls for May (forecast +89-93 thousand) and the unemployment rate (4.3%).
A crucial context that the media barely covers: the breakeven threshold for the US labor market is now abnormally low. According to Fed estimates, the economy needs only about 18 thousand new jobs per month to keep unemployment stable at current levels. The reason is demographics. The mass retirement of baby boomers and a sharp drop in immigration have led to a shrinking labor force. Every filled opening that goes to a domestic candidate doesn't create a "new" job in the statistics but sustains employment.
This means that even a "weak" NFP reading (say, 50-60 thousand) doesn't necessarily signal a recession. It could simply reflect structural changes. But the market, in its binary logic, might interpret such a reading as negative.
Who Wins and Who Loses
Winners: volatility traders. Those who bought options on the S&P 500, VIX, USD, or Treasuries expiring after June 5. The VIX is currently at low levels (around 14-15), meaning cheap options. Any strong move on Friday will bring multiplicative returns.
Winners: banks and brokers that profit from spreads and commissions. Higher volatility is bread and butter for market makers. Trading volumes on Friday will be 30-50% above average.
Winners: short sellers of Treasuries. If the data comes in strong, the yield on 10-year Treasuries could jump from the current 4.4% to 4.6-4.7%. Short positions will profit.
Winners: the US dollar (conditionally). Strong data = higher probability of a rate hike = dollar strengthening. The DXY could break out of the 96-100 range where it has spent most of the year.
Losers: holders of long positions in tech stocks. The tech sector (especially AI companies) is most sensitive to rates. Higher rates discount future cash flows, which form the basis of valuations for Nvidia, Microsoft, and others. With strong data, the Nasdaq could lose 2-3% in a single day.
Losers: holders of bitcoin and crypto assets. The crypto market has shown a negative correlation with the dollar and rates in recent weeks. The rising probability of a rate hike has already led to outflows from BTC ETFs. Strong data will amplify this pressure.
Losers: traders who bet on Fed easing. Those who opened long positions in stocks hoping for a rate cut will be forced to close them at a loss.
Losers: anyone holding a "neutral" position without hedging. A moderate portfolio without options or defensive assets in such volatility is playing Russian roulette.
What the Media Isn't Saying
Insight number one, absent from the headlines: even if NFP comes in weak, the Fed might still raise rates. Here's why.
The Fed is now looking not at employment, but at inflation. And inflation is driven by energy prices. Energy prices are driven by the conflict in the Strait of Hormuz. That conflict won't end in June. Even if a truce is signed (probability, in my estimation, no more than 35%), oil prices will remain above $85-90. That's enough to keep inflation above 3% through year-end.
In this scenario, the Fed cannot wait. Even if the economy starts to slow, the risk of an inflationary spiral (like in the 1970s) outweighs the risk of recession. Ed Yardeni, president of Yardeni Research, has stated outright that the Fed could raise rates as early as July. And he's right. The bond market is already demanding it—the yield on 2-year Treasuries has risen to 4.1% with the current Fed rate at 3.5-3.75%.
Insight number two: the market is pricing in a rate hike but not a recession. This is a contradiction that will resolve either in a crash or a repricing.
If the Fed raises rates, the economy will slow. Corporate profits will fall. The S&P 500, with a current P/E of around 22 (historically high), will correct. The only question is how much—10% or 20%? Options on the S&P 500 currently imply a move of about 2% on NFP day. That's not panic. It's the "calm before the storm."
The market is behaving as if a rate hike is "good news" because it's driven by a strong economy. But a rate hike caused by an inflationary shock (as now) has never ended well for stocks. Never.
Insight three, most important for understanding risk structure: NFP has systematically beaten forecasts in recent months. Three out of four leading indicators point to a strong report.
ISM Manufacturing Employment fell but remains in contraction territory. ISM Services Employment was virtually unchanged. However, the ADP Employment Report showed growth from 61 thousand to 109 thousand. And Initial Claims (4-week average) declined by 5 thousand. History shows: when three out of four indicators point up, NFP often comes in above consensus.
If this repeats in May and NFP comes in the 110-150 thousand range (as Investing.com forecasts), the probability of a rate hike will jump from 59% to 75-80%. That would be the number one bearish catalyst for stocks and crypto.
Forecast: Next 30 Days and 90 Days
30 days. June 5 is NFP day. It's a bifurcation point.
Scenario A (40% probability): NFP in the 80-100 thousand range, unemployment at 4.3%. Close to consensus. The market will initially breathe a sigh of relief, but then start analyzing components: hourly earnings (+0.3% m/m expected) and labor force participation rate (61.8%—lowest since 2021). If labor force participation continues to fall, it will signal structural weakness. S&P 500: -0.5% on release day, then consolidation.
Scenario B (45% probability): NFP >110 thousand. Trigger: strong data. Probability of a July rate hike rises to 70%+. S&P 500 falls 1.5-2% on Friday. Nasdaq falls 2.5-3%. Bitcoin tests $70,000. Dollar strengthens 0.5-1%.
Scenario C (15% probability): NFP <60 thousand. Shock from weakness. Market prices in recession. S&P 500 falls 2-3% ("bad news is bad news"). Bitcoin may fall further due to flight from risky assets. But in this scenario, the Fed likely won't raise rates, limiting the downside in the medium term.
My base case is the second one, "strong data." Too many indicators point to labor market resilience. Three out of four favor a strong report. ADP has already shown acceleration. I'm bracing for bad news for stocks on Friday.
90 days. By the end of August 2026, the picture will clear on two fronts: the Fed rate and Iran.
On rates: I expect the Fed to raise rates by 25 bps in July. Then a pause to assess the effect. Another hike in December if inflation doesn't slow. Key rate by year-end: 4.0-4.25% (currently 3.5-3.75%).
On Iran: a truce will likely be signed by mid-June. Oil prices will correct to $80-85 for Brent. This will ease inflationary pressure and give the Fed room not to force hikes.
Market outcome: S&P 500 correction of 5-8% in July-August, then recovery by year-end. Tech sector will suffer most—possibly a 10-12% correction. Dollar strengthens 2-3% against a currency basket. Bitcoin remains under pressure, caught between negative correlation with the dollar and ETF outflows. My target range for BTC at end-August: $68,000-74,000.
The main risk to this forecast is if the truce falls through. Then oil goes above $100, inflation accelerates to 4.5%+, and the Fed is forced to hike more aggressively—twice by 25 bps by year-end. In that scenario, the S&P 500 could lose 10-15%, and bitcoin could fall to $60,000-65,000.
Editorial Forecast
The dollar index DXY is expected to trade sideways with elevated volatility in the 97.50-99.00 range over the next 24-72 hours. Employment data will be the key driver. Confidence level: medium (60%). The main risk is NFP coming in outside consensus in either direction, triggering a sharp move of 0.7-1.2% in DXY in a single day. Strong data will strengthen the dollar (DXY above 99.5), weak data will weaken it (below 97.0). Without a clear catalyst, no directional move is expected this week.
— Editorial Team