US Inflation Data (CPI) for May Comes in at 2.9% YoY vs. 3.0% Forecast, Easing Pressure on the Fed
Dow Jones futures surged 300 points after the report's release. The main contributor to the slowdown was a decline in energy prices.
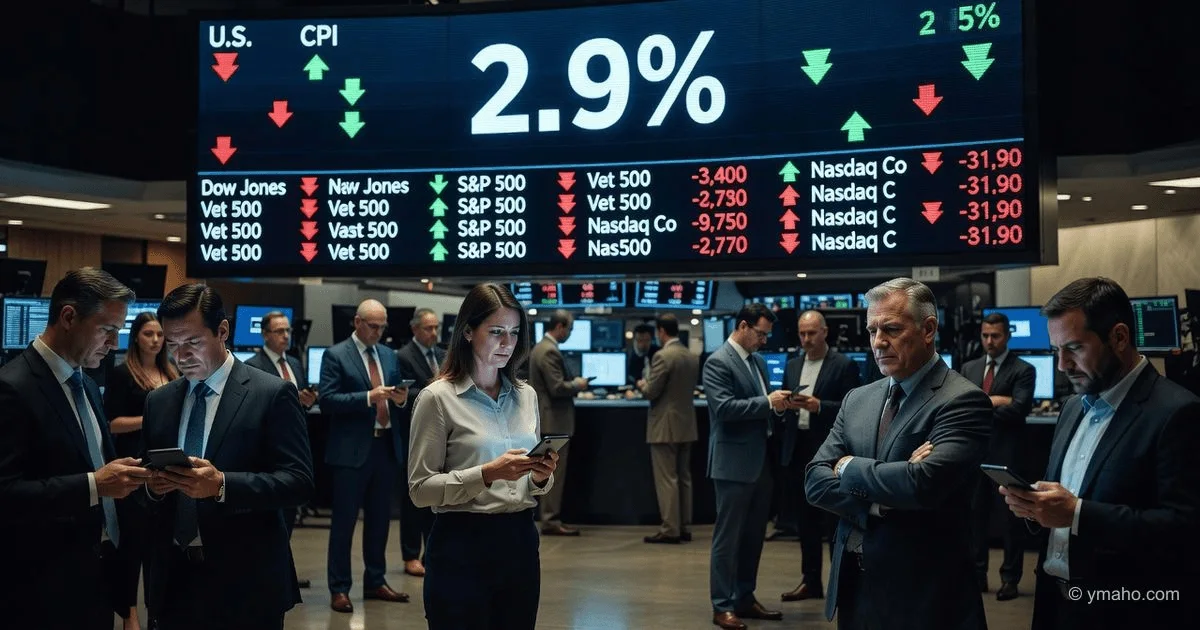
Inflation slowed to 2.9%, but the market crashed: why 'good' CPI is killing your portfolio
[The Gist]: What's really happening
The U.S. Bureau of Labor Statistics released May inflation data. The annual CPI came in at 4.2%, with a monthly reading of 0.5%. The core index (Core CPI), which excludes volatile food and energy, rose 0.2% month-over-month and 2.9% year-over-year. The market had expected Core CPI at 3.0%. The 0.1% difference is a statistical margin of error. But it was on this margin that Dow Jones futures surged 300 points. Then everything went south.
You might ask: how so? Inflation slowed more than expected — that's positive, right? But professional money was looking at a different number. Headline CPI (including energy) accelerated to 4.2% from 3.8% in April. And this 0.5% monthly increase was driven solely by energy: gasoline jumped 7% in one month, and the overall energy index rose 3.9%.
The real essence of what's happening is the divergence between 'clean' core inflation (which is indeed slowing due to normalization of rental rates after April's spike) and the 'dirty' reality where consumers are paying 7% more for gasoline, and the Middle East conflict threatens to push oil above $100 per barrel. The Fed, under new Chair Kevin Warsh, will be looking at headline inflation and geopolitics, not the 'perfect' Core CPI. And it's this nuance — that the Fed is preparing to ignore the 'good' numbers — that the market realized 15 minutes after the euphoria.
Timeline and Context
The table below is a chronology of how one report went through three stages of market perception. Note the gap between 'futures reaction' and 'actual trading reaction'.
| Date/Time | Event | Market Reaction | What Actually Happened |
|---|---|---|---|
| June 10, 8:30 AM | CPI release: headline +0.5% MoM, Core +0.2% MoM | Dow futures +300 points | Traders saw Core below the 0.3% forecast and started buying |
| June 10, 8:35 AM | TD Securities analysts comment: 'USD weakness was moderate' | DXY stabilizes at 99.86–100.00 | Professionals realized: Core CPI is an anomaly |
| June 10, 9:30 AM | New York trading opens | S&P 500 falls 1.6% | Market shifts focus to headline inflation of 4.2% and geopolitics |
| June 10, 2:00 PM | Household income and spending data released | Income up 0.4%, spending up 0.7% | Gasoline eats wage growth — negative for discretionary sector |
| June 10, 3:30 PM | Dallas Fed President Lorie Logan speaks | 'Inflationary pressures remain elevated' | Hawkish signal ahead of FOMC June 16–17 |
| June 11, 8:00 AM | Asian markets open | Nikkei -1.2%, Hang Seng +0.3% | Japan sensitive to oil, China to exports |
| June 11, 10:00 AM | European trading | DAX -0.8%, FTSE -0.5% | European investors take profits after three days of gains |
| June 16–17 | FOMC meeting (first for Kevin Warsh) | Expectation: rate 3.50–3.75% unchanged | Real drama: dot plot and 2027 forecasts |
The key point that 99% of commentators missed: the May inflation data is a 'statistical echo' of events two months ago. April's spike in rental costs (OER — owners' equivalent rent) was an anomaly due to a data collection glitch after the October government shutdown. May's normalization was expected by professionals. But the difference between expected and actual was only 0.1%. You can't build long-term forecasts on that difference. And the Fed, which is currently changing chairs and reviewing its entire communication system, will not make decisions based on statistical noise.
Who Wins and Who Loses
Winners (relative, as of June 10 close):
- Consumer Staples: +1.6% on Friday before the report, and this trend held. Kimberly-Clark rose 4.5%, Procter & Gamble 4.1%, Coca-Cola 3.5%. Investors are fleeing to companies selling toothpaste and toilet paper — goods bought regardless of gasoline prices.
- Healthcare: The sector showed resilience. REITs like Ventas (+3.7%) and Welltower (+3.0%) benefited from a combination of 'defensive sector + stable cash flow'.
- Utilities: Duke Energy +2.0%, NextEra Energy +0.2%. Regulated tariffs and dividend yields — classic safe havens in uncertain times.
- U.S. Dollar (DXY): Contrary to expectations, the dollar didn't crash after the 'soft' Core CPI. The index holds in the 99.86–100.00 range. Reason: strong employment data (172k new jobs in May) and a geopolitical premium.
Losers:
- Technology: Despite formally remaining a leader in relative strength, stocks fell. The Nasdaq 100 lost about 5% on Friday before the report, with no recovery. Reason: the AI bubble is deflating, and high rates are killing long-duration assets.
- Consumer Discretionary: Autos, furniture, luxury. A 7% monthly rise in gasoline means the average American family has $50–100 less per month for restaurants and entertainment.
- Long-term bonds (20–30 years): Their prices fell; the 10-year Treasury yield remained at 4.5284%. The bond market didn't buy the 'victory over inflation' narrative.
Who's in the 'gray zone': Bitcoin and cryptocurrencies. Total market cap fell 2.47% to $2.13 trillion. Bitcoin is weakening ahead of the Fed meeting, but this isn't panic — it's positioning. Traders are waiting for June 17 to gauge direction. A 98% probability of a rate hold is already priced in.
What the Media Isn't Saying
First. 'Core CPI slowing to 2.9%' is a number that doesn't match the real consumer experience. Let's break down the basket. Shelter rose 0.3% for the month, which is good — a slowdown from April's 0.6%. But shelter is 40% of the index. The other 60% rose more. Airfares jumped 2.7% in one month. Motor vehicle insurance rose 1.7% — but actually it dropped 1.7%? No, the BLS writes 'motor vehicle insurance dropped 1.7%' — but that's after a 20% annual increase, so it's not even a correction. Communication services rose 1.3% (thanks to tariff wars on roaming). Personal care expenses rose 1.0%.
Second. The labor market remains too hot for the Fed to cut rates. May employment data showed +172k jobs versus a forecast of 88k. That's nearly double expectations. With such an economy, the Fed cannot start an easing cycle — it would trigger a second wave of inflation. A Reuters poll of 102 economists: 72 expect the rate to stay in the 3.50–3.75% range through end of 2026. No cuts in 2026. Moreover, BNP Paribas forecasts a rate hike in December 2026. Yes, you heard that right: the Fed's next move could be UP.
Third, and most important. The change in Fed chair is not cosmetic. It's a tectonic shift in communication. Kevin Warsh, who took office on May 22, 2026, has already stated his intention to review the dot plot system. The traditional 'dot plot,' published after every second meeting, may be either radically changed or scrapped altogether. On June 17, at Warsh's first meeting, we'll see either a new version of the dot plot or a statement that the Fed will no longer 'hold Wall Street's hand.' Markets that have traded these signals for decades will find themselves in a vacuum. Volatility will spike. And that happens in exactly six days.
Forecast: Next 30 Days and 90 Days
Next 30 days (through July 11):
- June 16–17 — the main event of the month. The FOMC will almost certainly leave rates unchanged (98.2% probability). Focus on Warsh's press conference. If he signals that rates won't be cut in 2026 (or could even be raised), brace for a 3–5% S&P 500 correction.
- The dollar will remain strong. TD Securities expects DXY to hold at 99.86–100.00. The forecast is supported by geopolitics (Iran, U.S. conflict) and a strong labor market.
- Rotation from growth to value will continue. Tech stocks will be under pressure, especially the AI sector. NVIDIA shares, despite a strong earnings report two weeks ago, could lose another 5–7% before the Fed meeting.
- Oil (WTI) — the main risk. If Middle East escalation continues, prices could exceed $95 per barrel, pushing headline inflation back to 5% by July.
Next 90 days (through September 2026):
- The Fed will not cut rates in 2026. This is no longer a forecast but a consensus. 72 of 102 economists in the Reuters poll believe the rate will stay at 3.50–3.75% through year-end. BNP Paribas goes further, expecting a hike in December.
- The stock market will enter a sideways trend with elevated volatility. The S&P 500 will trade in a 5,500–6,000 range (below current levels) as multiples compress due to high rates.
- Consumer defensive sectors (Staples, Healthcare, Utilities) will outperform the market. This is the only place investors can get positive returns amid high uncertainty.
- Key risk: escalation with Iran. If the conflict turns into full-scale hostilities, oil could hit $120 per barrel. In that scenario, the Fed would be forced to raise rates in the middle of a recession — a classic 'stagflationary' shock that would crash both stocks and bonds.
Editorial Forecast
Asset: Bitcoin (BTC). Direction: moderate decline over the next 24–72 hours to the $58,000–$60,000 zone. Key levels: resistance — $65,000 (current level), support — $58,000 (psychological low from May 2026). Confidence level: medium (60%). Main risk: if at the June 17 FOMC meeting Warsh unexpectedly gives a 'dovish' signal (e.g., removes the phrase 'inflation remains elevated' from the statement), Bitcoin could make a sharp move to $70,000. However, given the Reuters poll of 102 economists and BNP Paribas's stance, the probability of a dovish scenario is estimated at less than 10%. We recommend reducing long positions until the Fed's rhetoric becomes clear.
This analysis represents the editorial opinion and does not constitute individual investment advice. All decisions to buy or sell assets are made at your own risk.
— Editorial Team