US Inflation Hits Three-Year High, Pushing Back Fed Rate Cut Prospects
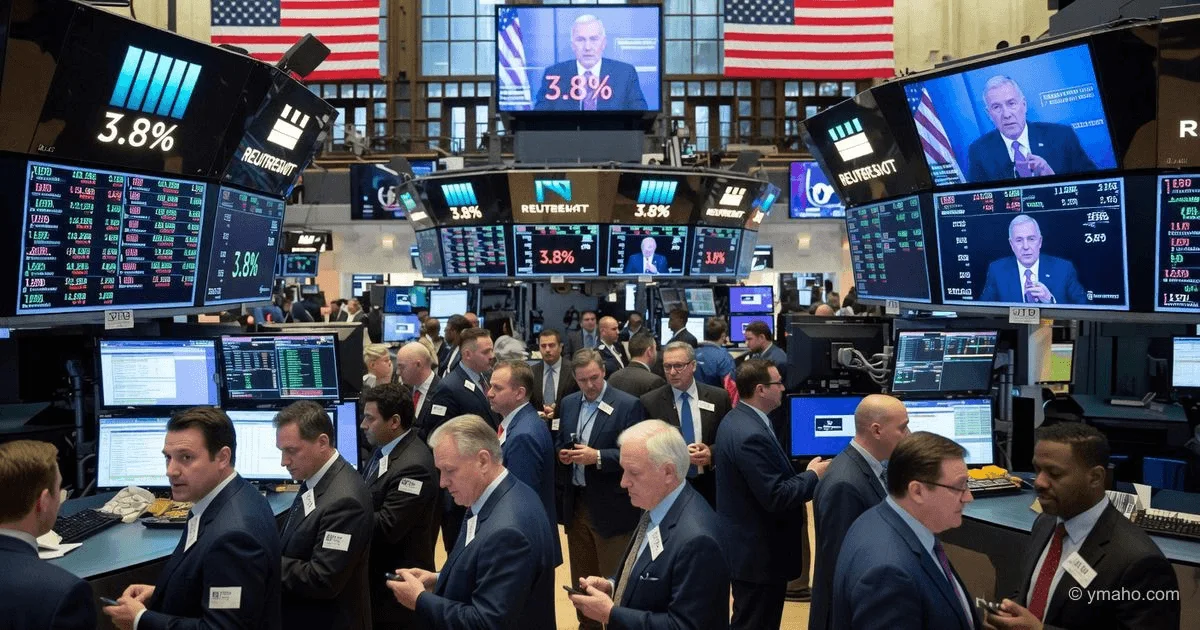
Consumer prices in the US rose to 3.8% in April amid an energy shock, forcing the Fed to maintain a hawkish stance and not rush to ease policy.
Headline: April US Inflation: Why 3.8% Is Not a 'Temporary Shock' but a Structural Break
Author: Independent Financial Analyst (former rates trader, macro hedge fund manager)
When the Bureau of Labor Statistics releases numbers, a superficial glance sees a 0.1% beat—from 3.7% to 3.8%. Stock markets fall 0.4-0.8%, ten-year Treasuries push yields up 4-5 basis points, the dollar gets a boost. Everyone goes home thinking, 'No big deal, energy shock, the Fed will wait.'
That's a mistake. I've worked with Treasury bonds and inflation derivatives for nearly two decades, and the last time I saw such a 'false calm' in markets was just before the start of the rate hike cycle in 2022. The April 2026 CPI is not an 'oil shock.' It's a signal that inflation has moved from the 'exogenous' category to the 'endogenous' category. When inflation becomes endogenous, the Fed can no longer 'look through it'—it must break it through a recession.
Let's break down why 3.8% is much worse than 4.5% a year ago.
[The Core]: What's Really Happening
In March 2026, I wrote internal notes: 'Beware of rising core inflation. Oil is the headline, housing and services are the reality.' April confirmed the worst fears. Headline inflation accelerated to 3.8% (forecast 3.7%), but that was expected. The shock is that core CPI (excluding food and energy) jumped to 0.4% month-over-month against a forecast of 0.3%.
Why is 0.4% scary? Because on an annualized basis, that's 2.8%, and this is the second consecutive month that core is accelerating. At FOMC meetings, everyone looks at core PCE, but core CPI is its older brother that hits first. April showed that the energy shock has started to 'leak' into rent and services.
Let's break down the core CPI components:
- Shelter: Rose 0.6% month-over-month versus 0.3% in March. Rents have reversed and are rising after several months of stabilization. This is the 'stickiest' component of inflation—it can't be quickly suppressed.
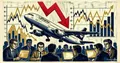
- Airfares: +2.8% month-over-month, +20.7% year-over-year. Jet fuel got more expensive, and airlines immediately passed it on to passengers.
- Apparel: +0.6% month-over-month, reflecting the ongoing impact of tariffs (which were introduced back in 2025 and are only now fully passed through to prices).
But the most important signal that 99% of commentators ignore: in April, real wages for Americans fell for the first time in three years. Inflation (3.8%) outpaced nominal wage growth (~3.5-3.7%). This is a psychological trigger for unions and workers. When people see their purchasing power declining, they start demanding higher wages. And wage increases are no longer an 'energy shock'—they are an inflationary spiral.
Timeline and Context
March CPI was bad—0.9% month-over-month, 3.3% year-over-year—but everyone blamed it on the 'emergency shock from the closure of the Strait of Hormuz.' Markets bought into the Fed's narrative: 'We will look through the temporary rise in energy prices.' Inflation expectations remained anchored.
April broke that narrative. Gasoline prices rose another 5.4% month-over-month, and heating oil rose 5.8% (annual growth 54.3%). But the scariest part isn't even gasoline. It's tomatoes (+15.1% month-over-month), coffee (+2.0%), beef (+2.7%). These goods have no direct connection to Hormuz. Their rise is either secondary effects (higher logistics and packaging costs due to oil), tariff effects, or simply speculative pricing.
Importantly, on May 2, 2026, March Producer Price Index (PPI) data was released. Headline PPI rose 0.5% month-over-month (expected 0.3%), but core PPI (excluding energy and food) rose only 0.1%. This created false hope. Now April CPI shows that producers have finally passed on price increases to consumers. The lag between PPI and CPI is 1-2 months—April became the 'pass-through' month.
The Fed is trapped. At the April 29, 2026 meeting, the rate remained at 3.5-3.75%, but three FOMC members (Hammack, Kashkari, Logan) voted to remove dovish language—the first time since 1992 that three members voted against the chair in a hawkish direction. That was a warning shot. April CPI was the second shot.
Winners and Losers
Winners:
- US energy companies (Exxon Mobil, Chevron). In April, WTI crude fluctuated between $90 and $101 per barrel, Brent between $95 and $110. With shale production costs around $45-55 per barrel, Exxon's margin exceeds 80%. Their stocks are the new 'safe haven,' outperforming gold in returns since the start of the conflict.
- Banks with large Treasury and rate derivative portfolios (JPMorgan, Goldman Sachs). Volatility on the yield curve is bread and butter for trading desks. The expectation that the Fed may not only refrain from cutting but raise rates in 2027 (71.5% probability per CME FedWatch) triggers a shift from equities to fixed-income bonds. Banks earn on spreads and commissions.
- Walmart. When inflation hits wallets, consumers 'downgrade' from Target and specialty retailers to Walmart. The company has already reported sales growth in the food segment driven by households earning over $100,000 who previously didn't shop there. Walmart is a recession asset.
Losers:
- Tech stocks with high debt loads (Zoom, Peloton, many biotechs). Their value is highly dependent on discounting future cash flows. The longer rates stay high (or rise), the lower the present value of these companies. Growth stocks will underperform value stocks throughout 2026.
- Target. Unlike Walmart, Target is heavily reliant on discretionary goods (apparel, electronics, home decor). A consumer paying $4.30 per gallon of gasoline won't buy a new sofa or mixer. Target is forced to hold prices, squeezing margins, or lose sales.
- Class B and C real estate in US 'Sun Belt' states (Texas, Florida, Arizona). In these regions, flood and hurricane insurance has skyrocketed, mortgage rates are stuck above 6.5%, and now core inflation is hitting renters' incomes. Capitalization of these assets will begin to decline in the third quarter.
What the Media Isn't Saying
The biggest omission is the role of the 'statistical echo' of 2025 tariffs. Many analysts forgot that in April 2025, additional tariffs on Chinese goods took effect (in response to escalation in the Pacific). Their impact on consumer prices has a 9-12 month lag. That means April 2026 is precisely the month when 'tariff inflation' peaked and overlapped with 'oil inflation.' This is a double blow that the Fed could not have foreseen in its baseline scenarios a year ago.
Second is the Owners' Equivalent Rent (OER) index. Statistics are collected with a delay. The rise in rental rates we see now in April 2026 reflects decisions made by landlords in February-March. But real estate markets in San Francisco and New York show that rental rates continued to rise in April-May. This means May and June CPI will likely show even higher housing numbers. The 'peak of housing inflation' that was talked about in 2025 never materialized—or it will be delayed until 2027.
Finally, on policy: On May 12, immediately after the CPI release, Chicago Fed President Austan Goolsbee said in an interview that he is concerned not about energy but about the services sector. 'If you look at non-energy components, such as services, and if that indicates an overheating economy, then the Fed must think about how to break the chain of inflation escalation,' he said. This is a direct hint at a possible rate hike. But Goolsbee is no idiot. He understands that raising rates when inflation is supply-driven (supply shock) rather than demand-driven could kill the economy without killing inflation. Yet he still talks about hiking. That means within the Fed, there is real fear of an inflationary spiral.
Forecast: Next 30 Days and 90 Days
30 days (June to early July 2026):
The Fed at its June 16-17 meeting will keep the rate at 3.5-3.75%, but the hawkish tone will intensify. The probability of a hike by December 2026 is already 32%, and by April 2027 it's 71.5%. Markets will start pricing in at least one hike in the first half of 2027. This means the yield curve (2-10 years) will remain inverted, but the inversion will narrow as long-term rates rise.
The dollar will strengthen against the euro (EUR/USD below 1.05) and the yen (USD/JPY may test 158-160), as the Bank of Japan continues interventions and the ECB is paralyzed by fear of recession. Gold will stay in the $4350-4550 range with short-term dips on strong US data, but each such dip will be bought by Asian central banks.
90 days (September 2026):
The key moment will be May and June inflation data. If core CPI remains at 0.3-0.4% month-over-month, then by September markets will start pricing in a probability of a rate hike at the November meeting. This will be a shock that crashes stock indices (S&P 500 could correct 10-15%) and pushes 10-year Treasury yields to 5% for the first time since 2023.
Bank stocks will continue to rise (the yield curve will steepen from the bottom up, improving their net interest margin). Homebuilder and discretionary retailer stocks will fall 20-30% from current levels. Bitcoin, despite its 'digital gold' status, will be under pressure due to tightening dollar liquidity—its correlation with the Nasdaq remains high.
Editorial Forecast
Asset: 10-Year US Treasury Yield.
Direction: Up in the next 72 hours, followed by consolidation above a key level.
Key Levels: Current level ~4.45%. A break above 4.50% opens the path to 4.55-4.60%. Support at 4.35%.
Confidence Level: High (70%).
Main Risk: A sudden de-escalation in the Middle East (even rumors of a truce) could crash oil to $80 per barrel, lowering inflation expectations and bringing yields back to 4.15-4.20% within a day. Watch for statements from Qatar and Oman.
— Editorial Team