Dollar Hits Yearly Highs on Hawkish Fed Signal and US-Iran Peace Deal
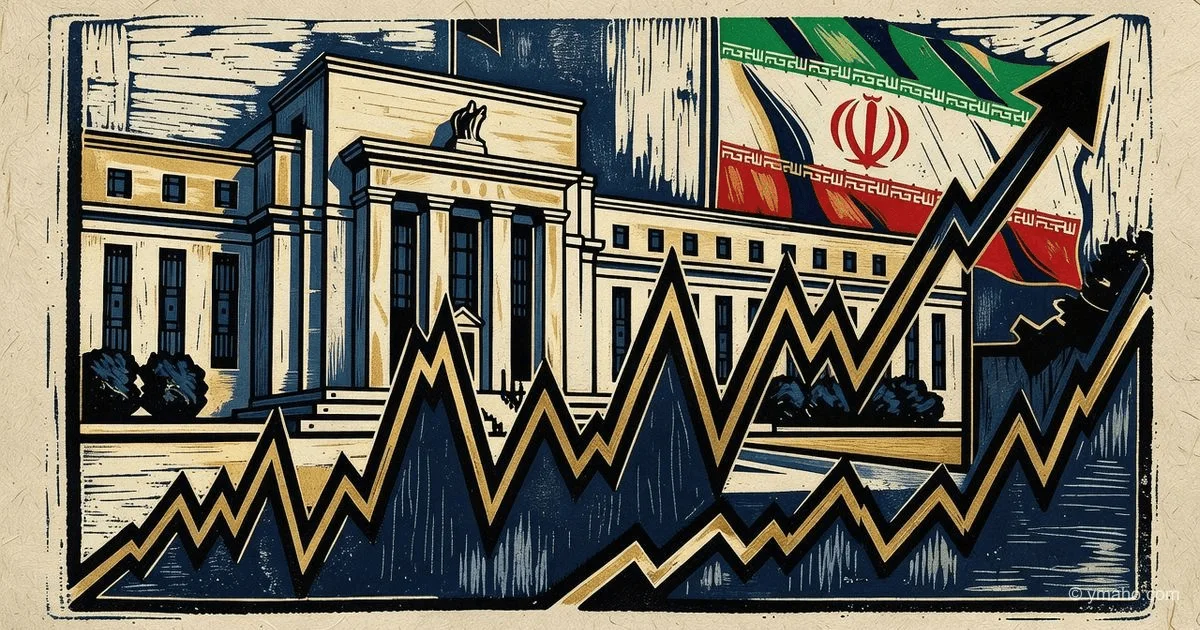
The dollar index hit a one-year peak after the Fed held rates steady, but the dot plot signaled a possible rate hike by year-end, while the Iran deal pushed oil prices lower.
Dollar at Yearly Highs: Why the Market Misses the Real Threat
[The Gist]: What's Really Happening
Formally, the US dollar hit new yearly highs on the DXY index (101.07) on two pillars: a hawkish Fed signal and hopes for a peace deal with Iran. But that's just the tip of the iceberg. The real driver is a paradigm shift in Fed communication that most market participants haven't fully grasped yet.
Kevin Warsh, at his first meeting on June 16, did something unprecedented: he refused to publish his own "dot plot," slashed the press release to a minimum, and stated that forward guidance was no longer "appropriate." The dot plot now has 18 dots instead of 19 — Warsh simply didn't provide his forecast. This isn't just a technical change. It's a fundamental break from the Powell era, when markets were accustomed to clear signals about the future path.
Nine of the 18 Fed officials now forecast a rate hike by year-end. Three see a 25-basis-point hike, five see 50 bps, and one sees 75 bps. The market prices in a 66% probability of at least one hike. Meanwhile, inflation accelerated to 4.2% in May — a three-year high. This isn't just a "hawkish signal." It's a full-blown reversal of the monetary cycle that the market is only beginning to digest.
In parallel, the Iran agreement extended a truce for 60 days, creating an illusion of de-escalation. Brent crude fell below $80 for the first time in three months. But this illusion is fragile: Swiss talks have already been postponed, Iran is questioning the details, and Trump has renewed threats. Iran's official statement about closing the Strait of Hormuz was contradicted by ship-tracking data, but the very fact of such rhetoric is a bearish signal for the dollar in the medium term.
Timeline and Context
Understanding the current situation requires a clear sequence of events over the past week:
| Date | Event | Consequence |
|---|---|---|
| June 16 | First Fed meeting under Warsh. Rate held at 3.5–3.75%, but dot plot eliminated all rate cut forecasts for 2026 | Futures price in 66% probability of a hike by year-end |
| June 16 | Warsh abandons forward guidance, doesn't publish his own forecast, slashes Fed statement | Markets lose their "anchor" for forecasts, expectation volatility spikes |
| June 17–20 | Stocks fall on hawkish signal, then recover on Iran peace hopes | S&P 500 +1.0% for the week, Nasdaq 100 +2.6% |
| June 20 (weekend) | US and Iran confirm 60-day truce, sign memorandum of understanding | WTI crude falls below $80 for the first time since the war began |
| June 21–22 | Swiss talks postponed, Iran questions signing procedure | DXY rises to 101.07 — yearly high |
Key takeaway from the timeline: The market is simultaneously pricing in two conflicting scenarios — Fed tightening (bullish for the dollar) and Middle East peace (bearish for the dollar via lower oil). So far, the first factor is winning, but the balance is extremely fragile.
Winners and Losers
Winners:
- US stock indices — S&P 500 +1.0%, Nasdaq 100 +2.6% for the week. Reason: falling oil lowers inflation expectations and reduces pressure on corporate margins. Semiconductors are particularly strong (Intel +13% on Apple deal, Asian chipmakers lead the region).
- Investors in US Treasuries — 10-year yields hold at 4.45%, offering attractive real yields amid uncertainty in Europe and Asia.
- Japanese exporters — TOPIX rose 4.2% to record levels as the yen weakened against the dollar (USD/JPY approaching 162). A weak domestic currency is a traditional driver for export-oriented Japanese corporations.
Losers:
- China — MSCI China fell 2.8%, Hang Seng at yearly lows on fears of Fed rate hikes and dollar strength. Chinese assets are particularly vulnerable because a strong dollar tightens global financial conditions and pressures emerging markets.
- Emerging markets broadly — EM rose 4.2% for the week, but this was solely due to Asian semiconductors (Taiwan, South Korea). The broader EM portfolio (Latin American, African, Middle Eastern markets) is under pressure from a strong dollar and capital outflows.
- Gold holders — Third consecutive weekly decline, price fell 1.3% to $4,156. This is unusual for gold during geopolitical instability, but dollar strength and rising real rates outweigh.
Hidden loser — Bank of Japan. The yen trades near 161.46–161.80 per dollar, a level that already triggered interventions in April and May totaling about ¥11.7 trillion. The BOJ just raised its rate to 1% for the first time since 1995, but that wasn't enough to stop the yen's fall. The policy gap with the Fed remains enormous, and Japanese authorities are effectively cornered: interventions don't work, and raising rates above 1% is difficult due to debt burdens.
What the Media Isn't Saying
Insight #1: Warsh isn't just a hawk. He's rebuilding the architecture of monetary policy.
Most commentators focused on the "hawkish" nature of Warsh's first meeting. They miss the main point: he is creating five working groups to review communications, the balance sheet ($6.7 trillion), data sources, employment metrics, and inflation. This isn't just a change in tone. It's a complete overhaul of how the Fed interacts with markets.
Warsh said outright: "I can't give you any forecasts about what we'll do next. But the good news is that our next meeting is in six weeks." For markets used to Powell's predictability, this is shock therapy. In the short term, it boosts dollar demand — investors price in a premium for uncertainty. But in the medium term, it creates a risk of sharp moves at every Fed meeting, as the market tries to guess Warsh's next move. Higher volatility isn't always good for the dollar.
Insight #2: Peace with Iran is a bearish factor for the dollar that the market underestimates.
The paradox of the current moment is that the dollar is rising on the Iran deal. But this contradicts classic logic: de-escalation in the Middle East → lower oil → lower inflation expectations → less need for tight Fed policy → weaker dollar.
So why is the dollar rising? Because the market is focusing on the second derivative: oil falls, so inflation will slow, so rates won't need to rise as much. But this is a misinterpretation.
In reality, if the Iran peace holds (a big "if"), the flow of Iranian oil to the market will reinforce disinflationary trends. That would allow the Fed not to hike, and possibly even return to discussing cuts. In that scenario, the dollar should weaken, not strengthen.
Why isn't the market pricing this in? Because everyone remembers 2019: the Middle East peace process collapsed, and oil surged 15% in one day. The market is pricing in the risk of a deal breakdown, not its sustainability. So the dollar rises now — as insurance against a resumption of conflict. But if the deal holds, that insurance will prove excessive, and the dollar could correct sharply.
Insight #3: Thursday's PCE data is a trap for dollar bulls.
Consensus expects core PCE to accelerate to 0.3% month-over-month. That would strengthen the hawks' argument and seemingly support the dollar. But Warsh has already indicated his policy looks at a broad set of data, not just PCE. Moreover, he created a working group specifically to review what data the Fed uses. This means even a strong PCE may not trigger the expected reaction if Warsh decides that inflation in other sectors (services, housing) is slowing.
Insight #4: The $119 billion inflow into US funds last week — is it the "last call"?
A record inflow into US funds [$119 billion in a week] signals an extreme consensus around "American exceptionalism." The Nasdaq 100 is up 24% year-to-date. These are overheated levels that usually precede a correction. When everyone has already bought the dollar and US stocks — who's left to buy?
Forecast: Next 30 Days and 90 Days
30 days (through end of July):
DXY will remain in the 100.5–102.0 range. The market will be buffeted by conflicting signals — hawkish Fed versus potential Iran peace. Key levels:
- EUR/USD — 1.1400–1.1500, testing the lower bound likely after a strong PCE
- USD/JPY — 160–163, with high risk of BOJ intervention around 162
- GBP/USD — 1.3150–1.3250, with additional pressure from UK political uncertainty (change of prime minister)
90 days (through end of September):
The most likely scenario is a dollar correction, provided:
- The peace process with Iran enters a sustainable phase (even without a final deal, but with a ceasefire regime holding)
- US inflation data begins to show a sustained slowdown
- Warsh gives at least a hint that a rate hike is not predetermined
In this scenario, DXY could retreat to 98–99, EUR/USD to 1.1700–1.1800. But if the deal collapses, oil returns to $90–100, the dollar moves above 103, and we see a new round of global inflation.
Editorial Forecast
Based on current data, we expect a short-term rise in USD/JPY to 162.5–163.0 within 24–72 hours on the back of sustained hawkish Fed expectations and no immediate signals of BOJ intervention. The key resistance level is 162.00; a break above would accelerate the move to 163.50. Confidence level — medium, with the main risk being a sudden statement from Japan's Ministry of Finance about readiness to intervene, which could crash the pair 150–200 pips in a few hours. This is an editorial opinion, not an investment recommendation.
— Editorial Team