Geopolitics Weighs on Markets: Iran Ceasefire and Oil Drop Amid Key Inflation Data Expectations
Dow and S&P 500 futures decline due to Middle East instability, despite a ceasefire mechanism agreement between the US and Iran after the closure of the Strait of Hormuz. Brent crude fell 1.9% to $79.03 per barrel, as markets await the release of the PCE index on Thursday, which could confirm the Fed's hawkish stance and push Treasury yields to new highs.
Analytical Review: Iran Ceasefire — Geopolitical Pause or Investor Trap?
[The Gist]: What's Really Happening
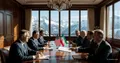
Markets opened the week of June 22, 2026 in a state of deep ambivalence. On one hand, the world witnessed the signing of a historic 14-point memorandum of understanding between the US and Iran — a document that formally ends hostilities on all fronts, reopens the Strait of Hormuz, and promises Iran $300 billion for reconstruction. On the other hand, President Trump, on the very day negotiations began in Switzerland, threatened to resume war if proxy attacks on Israel did not stop. Tehran, in turn, closed the strait again just before the meeting, allowing only 32 and 26 ships over the weekend compared to normal traffic.
The oil market reacted to this contradiction with a classic price spike — Brent rose to $82.30 per barrel early in the Asian session before crashing 1.9% to $79.04 when news of the agreement broke. But this is just the tip of the iceberg. Dow Jones futures are down 0.05%, S&P 500 futures down 0.09%, while the Nasdaq 100, contrary to logic, is up 0.14%. The market is "voting" for the tech sector despite geopolitical turbulence — and this is the first signal that investors do not believe in lasting peace.
Non-obvious insight the media misses: The real ceasefire is not between the US and Iran — it is between Israel and Hezbollah. The memorandum clearly states that any continuation of Israeli military operations in Lebanon will be considered a "breach of agreements," and Tehran reserves the right to take "necessary measures." However, Israel did not sign this document. Its Defense Minister, Israel Katz, has already stated that the country will not abandon controlled territories in Lebanon. The first and most fragile element of the deal is a ceasefire agreement without the participation of the key player engaged in combat. This is not peace — it is a pause, during which Tehran buys time, lifts the blockade, and gains access to frozen assets, while the US gets a promise to "make efforts" to reopen the strait.
Timeline and Context
To understand the fragility of the current equilibrium, it is necessary to reconstruct the sequence of events over recent months.
| Date | Event | Market Impact |
|---|---|---|
| February 28, 2026 | Start of US-Iran military conflict, closure of Strait of Hormuz | Brent crude surges from $67 to peak of $126.41 in May |
| April-May 2026 | Escalation of conflict, record rise in Treasury yields | 10-year bonds added 50 bps from year lows |
| June 14, 2026 | Announcement of ceasefire agreement | Brent falls 4% to $83.82, stock indices rise 1-5% |
| June 17, 2026 | First FOMC meeting under Kevin Warsh | Hawkish signal, markets price in 75% probability of rate hike by September |
| June 19, 2026 | MoU signing ceremony in Switzerland | Formal start of 60-day ceasefire period |
| June 21-22, 2026 | Iran closes strait before talks, Trump threatens attacks | Oil fluctuates between $82 and $79, futures decline |
| Indicator | Pre-Conflict (Feb 2026) | Crisis Peak (May 2026) | Current Level (June 22) |
|---|---|---|---|
| Brent, $/bbl | 67 | 126.41 | 79.04 |
| 2-Year Treasuries, % | ~3.5 | 4.22 (high since early 2025) | 4.23 |
| S&P 500 Futures | ~6,000 | ~7,560 | 7,560 |
| USD/JPY | ~149 | 161.96 (resistance) | 161.44 |
Source: Reuters, CME, trading data
The main paradox of the current moment: The agreement is signed, but Iran has already publicly stated that it does not rule out introducing a fee for passage through the Strait of Hormuz after the 60-day grace period expires. For the US, which fought for "free, open, and unimpeded" navigation, this is a red line. But Tehran understands: Washington has invested too much political capital in this deal and will not start a new conflict over a "service fee."
Who Wins and Who Loses
Winners #1: Iran. The country secured the lifting of the naval blockade within 30 days, the end of all economic sanctions (including UN Security Council sanctions), access to frozen assets, and a promise of a $300 billion reconstruction fund without any financial contribution from the US. At the same time, Tehran does not disarm or abandon its nuclear program — it merely agrees to "reprocess" enriched uranium under IAEA supervision without a specific timeline.
Winners #2: Airlines and shipping companies. The reopening of the Strait of Hormuz reduces insurance premiums and transit times. Shares of Maersk and Hapag-Lloyd are likely to get a short-term boost, although long-term contracts have already priced in the risk of closure.
Winners #3: Speculators in oil futures who locked in profits on the decline. Volatility in the $79–$82 per barrel range in a single day created ideal conditions for intraday trading.
Losers #1: US shale oil producers. Brent falling to $79 is below the breakeven level for many shale projects ($80–$85). If prices settle below $80, we will see a reduction in drilling activity in the Permian Basin within 6–8 weeks.
Losers #2: Commodity market bulls holding long positions. The sudden 1.9% drop on a day when markets expected a rise led to forced liquidation of long positions.
Losers #3 (potential): Emerging market bondholders. Rising Treasury yields and a strengthening dollar, fueled by a hawkish Fed, make developing country debt less attractive. The MSCI EM index is likely to continue its correction.
What the Media Isn't Saying
First: The "ceasefire" does not apply to Yemeni Houthis and their attacks on ships in the Red Sea. The US-Iran memorandum does not include Tehran's commitment to control its proxies in Yemen. Attacks on commercial vessels in the Bab el-Mandeb Strait may continue, creating a new, third, chokepoint for global trade. Markets have not yet priced in this risk.
Second: The 60-day period is not a guarantee of peace, but a deadline for new escalation. Clause 3 of the memorandum clearly states: the parties commit to reaching a final agreement within a maximum of 60 days. If a permanent treaty is not signed by mid-August 2026 (and disagreements over the nuclear program — 5 years vs. 15–20 — remain fundamental), the ceasefire expires. Moreover, Israel, which did not participate in the talks, has every reason to resume operations in Lebanon at any moment, provoking Iran to respond and automatically voiding the memorandum.
Third: The $300 billion for Iran's reconstruction is a "golden parachute" for Tehran without US control. The wording "the US is not obligated to pay a cent" is a technical trick. The fund is formed by regional partners (Saudi Arabia, Qatar, UAE) and, in effect, from returned Iranian assets. This gives Iran $300 billion to rebuild its economy without any leverage for Washington. If in 60 days Tehran returns to uranium enrichment, that money will already have been spent. The US finds itself in a position where it paid an advance for a peace that has not yet arrived.
Forecast: Next 30 Days and 90 Days
30 days (through end of July 2026): The key event will be the release of the PCE index on June 25. Economists forecast core inflation to accelerate to 3.4% year-over-year from 3.3%. If the data matches or exceeds expectations, markets will reprice the probability of a September rate hike, which is already at 75%. This could send 2-year Treasury yields above 4.30% and strengthen the dollar to 162 yen, triggering a new wave of intervention by Japan. Brent crude will fluctuate in the $75–$82 range, reacting sensitively to any news about ceasefire compliance. Equity markets, especially the S&P 500, will remain under pressure — a hawkish Fed and high yields make stocks less attractive compared to bonds.
90 days (through end of September 2026): Market fate depends on two factors: whether US-Iran negotiations conclude with a permanent treaty, and whether inflation begins to slow after the May-June peak. If a permanent treaty is signed (probability assessed as low — less than 30%), oil could fall to $65–70, giving the Fed room to forgo rate hikes and leading to a stock market rally. If talks fail and Israel resumes operations in Lebanon, oil will return to $90+, inflation will accelerate, and the Fed will be forced to raise rates by 25–50 bps at the July 29 meeting (probability of this scenario, per CME estimates, is 32%). In that case, the S&P 500 could correct 5–10% from current levels.
Editorial Forecast
**Asset: Crude Oil Brent (BNO, BRN). Direction: Moderately bearish in the short term with potential for a bounce. Target: Range $77.50 – $80.50 per barrel in the next 24–72 hours. Confidence level: High. Main risk: The release of oil inventory data from API (Tuesday) and EIA (Wednesday) could change the picture — if inventories decline by more than 2 million barrels, Brent could return to $82. However, the fundamental driver remains political uncertainty: the market has already priced in the reopening of the strait, but not the risk of renewed Houthi attacks or Israel's non-compliance with ceasefire terms. We recommend locking in profits on long positions and considering short positions on a bounce to $81. Investors in oilfield service stocks (SLB, HAL, BKR) should be prepared for volatility — their correlation with Brent remains high.
— Editorial Team