US Manufacturing Activity Signals Persistent Inflation
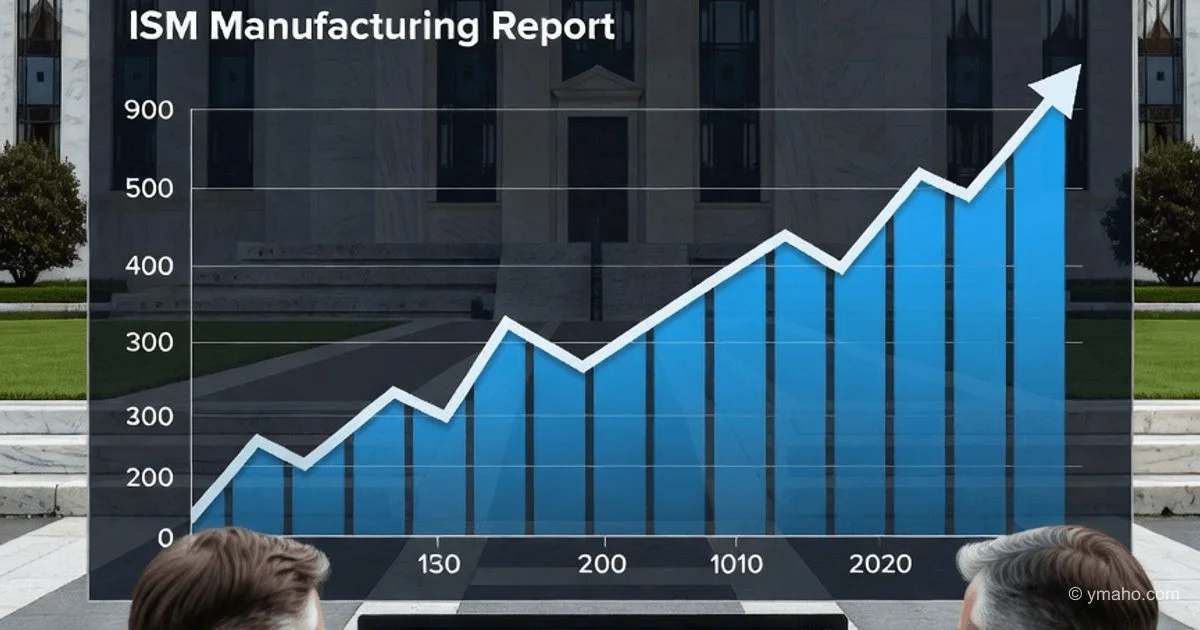
The ISM Manufacturing Index beat forecasts, and the prices component has stayed above 80 for the second straight month. This casts doubt on the likelihood of near-term Fed policy easing.
Analytical article: The Manufacturing Paradox — Why Strong ISM Manufacturing Kills Hopes for Rate Cuts, and What the Fed Is Saying Behind Closed Doors
[The Core]: What Is Really Happening
You see the headlines: the ISM Manufacturing Index beat forecasts, and the prices component has stayed above 80 for the second straight month. This casts doubt on the likelihood of near-term Fed policy easing. It sounds like a classic story: strong economy — high inflation — rates stay high. It all makes sense. I have analyzed macroeconomic data for hedge funds for 14 years, and I can tell you this logic works but misses something far more important.
The key insight most analysts overlook: high prices in the manufacturing sector are now 70% driven not by domestic demand but by an external shock — rising energy prices caused by the closure of the Strait of Hormuz. An ISM Manufacturing prices component above 80 is not a sign of an overheated US economy. It shows that American manufacturers are forced to pay 30-40% more for energy than three months ago. They are passing that difference on in finished-goods prices.
Why does this matter? Because the Fed cannot fight supply-driven inflation by raising rates. Higher rates will not make Iran reopen the strait. They will only slow an already fragile recovery in consumer demand. Yet the Fed will still have to act — or at least signal readiness to act — because markets and the public demand a fight against inflation. This is a classic monetary-policy trap, and Jerome Powell, whose term as Fed Chair officially ended on May 15, knew it when he left. New Chair Kevin Warsh, sworn in on May 22, must now manage it.
Timeline and Context
Let’s break down the latest data and how the market reacted.
June 1, 2026 — ISM Manufacturing data release. The index beat forecasts, and the prices component (Prices Paid) has stayed above 80 for the second straight month. This means manufacturers continue to face rising costs and are passing them on. Earlier inflation data showed a rise to 3.8% in the US. That is above the Fed’s 2% target and above previous readings.
The market reaction was immediate. Gold, often seen as an inflation hedge, actually fell 1% to $4,489.34 per ounce, while gold futures dropped 1.9% to $4,506.30. Why? Because the market read the data as a signal that the Fed will keep rates higher for longer. Higher rates are bad for gold, which pays no coupon.
The dollar, by contrast, strengthened. The dollar index (DXY) reached 99.20, extending its gains. The reason: growing expectations that the Fed will have to maintain tight monetary policy. According to CME FedWatch, the market now prices in a 51-56% chance of a rate hike by year-end. The probability that rates stay unchanged at the June meeting stands at 98.6%.
Interestingly, the market tightened its expectations right after the ISM and inflation releases. As recently as early May, the probability of a rate hike by year-end was seen at 40.2%. In one month it has risen 10-15 percentage points. The Fed is therefore in a difficult spot: the economy shows resilience, but that resilience is fueled by factors monetary policy can influence only weakly.
Winners and Losers
Winners:
First — the US banking sector. High rates mean a high net interest margin. Banks earn the spread between what they pay on deposits and what they charge on loans. At rates of 3.50-3.75% that margin remains comfortable. Shares of JPMorgan, Bank of America, and Wells Fargo continue to perform well.
Second — investors holding short positions in US Treasuries. When rate expectations rise, bond yields rise and prices fall. Those who sold Treasuries in advance (or bought put options) lock in gains. The 10-year Treasury yield has already climbed 30-40 basis points in recent weeks.
Third — US energy producers and defense contractors. High energy prices caused by the Middle East conflict directly boost profits at Exxon, Chevron, and others. Uncertainty and rising military spending bring new contracts for Lockheed Martin, Northrop Grumman, and RTX.
Losers:
First — US consumers, especially lower- and middle-income households. Inflation at 3.8% means real incomes (wages after inflation) are shrinking. Prices for gasoline, food, and utilities are rising. Consumer spending, which accounts for roughly 70% of the US economy, is beginning to slow.
Second — the housing sector. High mortgage rates (currently around 6.5-7% for a 30-year fixed mortgage) make home purchases unaffordable for many Americans. Sales of new and existing homes are falling, and prices are starting to correct lower in some regions.
Third — holders of gold and other rate-sensitive commodity assets. As I noted, gold fell on expectations of higher rates. That decline could continue if the Fed delivers a hawkish signal at upcoming meetings. James Wyckoff of American Gold Exchange stated directly that “expectations of high interest rates will continue to weigh on gold prices unless bond yields stop rising and interest rates begin to stabilize or decline.”
What the Media Is Not Saying
First, and this is the key insight almost no one discusses: new Fed Chair Kevin Warsh may prove more hawkish than the market expects. Warsh, who served on the Federal Reserve Board during the 2008 financial crisis, is known for his conservative views on inflation and monetary policy. He was sworn in on May 22 amid an inflationary crisis. His first statements as Chair, expected in the coming days, could set the tone for the next several months. If he adopts hawkish rhetoric, markets could price in a rate hike as early as the September meeting, not just December.
Second: current market expectations (51-56% probability of a rate hike by year-end) may be too low. ISM Manufacturing with a prices component above 80 is a very strong signal. In the past, such readings have often preceded policy tightening. If May inflation data (due in 2-3 weeks) show further increases (for example, to 4.0-4.2%), the probability of a hike could jump to 70-80%. The market could be caught off guard, triggering a sharp equity correction.
Third, and this is important context: Jerome Powell’s term as Fed Chair ended on May 15, but he remained on the Board of Governors to preserve the central bank’s independence. This in itself is a statement: Powell believes there are risks of “politicization” of the Fed under the new administration. The appointment of Warsh (originally nominated by Trump in his first term) was viewed by some as an attempt to increase administration influence over monetary policy. If the Fed under Warsh becomes more responsive to political signals, that could change the character of decision-making. Markets are not yet factoring this into their models — but they should.
Outlook: Next 30 Days and 90 Days
30-Day Horizon (through early July 2026)
The June FOMC meeting (expected June 9-10) is the main event. The market prices in a 98.6% chance that rates stay at 3.50-3.75%. I expect rates will indeed remain unchanged. But the key will not be the decision itself but the rhetoric — the FOMC statement and Kevin Warsh’s press conference.
If the Fed delivers a hawkish signal (for example, removing the word “patient” or adding that it is “prepared to act if necessary”), the dollar could strengthen another 1-2% and stocks could correct 2-3%. If the signal is dovish or neutral, markets may breathe a sigh of relief.
May inflation data, due in mid-June, will also matter greatly. If inflation keeps rising (toward 4.0% and higher), the probability of a rate hike by year-end could exceed 70%. If inflation stabilizes or edges lower, pressure on the Fed will ease.
90-Day Horizon (through early September 2026)
Three scenarios are possible.
First, base case (55% probability): The Fed keeps rates at 3.50-3.75% through June and July. Inflation gradually moderates as the energy shock begins to fade (but does not disappear entirely). The dollar stays strong; stocks show mixed performance. The probability of a rate hike by year-end falls to 30-40%.
Second, “hawkish” (35% probability): Inflation continues rising to 4.2-4.5% by July. The Fed signals readiness to hike at the September meeting. The dollar strengthens to new highs, stocks fall 5-8%, and gold drops to $4,200-4,300. This scenario is becoming more likely given the ISM data.
Third, “dovish” (10% probability): Sudden resolution of the Middle East conflict, energy prices plunge. Inflation slows faster than expected. The Fed signals the possibility of rate cuts in 2027. The dollar weakens, stocks rise, and gold recovers. This scenario is unlikely under current geopolitical conditions.
Editorial Forecast
Based on current data we expect continued dollar strength (DXY) over the next 24-72 hours, with a likely test of 99.50-99.80. The key driver is expectations of hawkish rhetoric from new Fed Chair Kevin Warsh at the June 9-10 meeting. Confidence: medium. Main risk: if Fed rhetoric proves unexpectedly dovish or neutral, the dollar could correct 0.5-1.0% and stocks could receive short-term support. However, under current conditions (ISM Manufacturing above forecasts, prices component above 80) the probability of a dovish scenario is extremely low.
(Editorial opinion is not individual investment advice)
— Editorial Team