US Inflation Hits Three-Year High Amid Resilient Labor Market
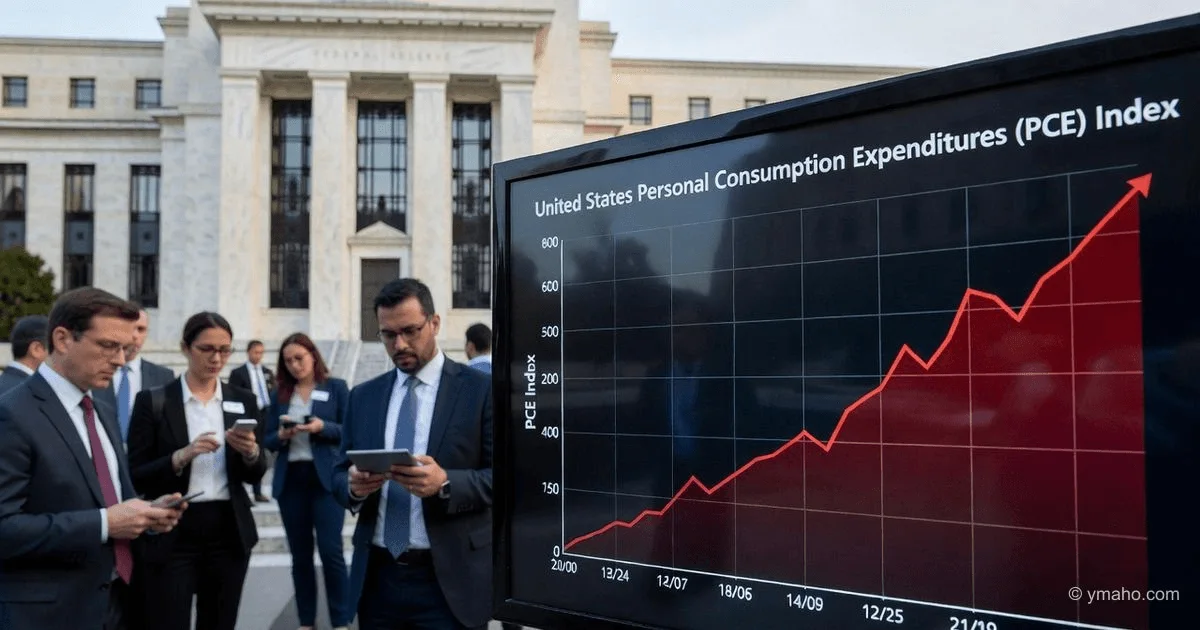
The core PCE index jumped to 3.3% year-over-year in April, reaching its highest level since late 2023 amid the energy crisis. Meanwhile, the US economy shows resilience: the labor market is near full employment, and GDP in the second quarter is estimated by the Atlanta Fed to grow by 3.0%.
Headline: Three-Year High Inflation in the US: Why the Fed Can't and Won't Stop It
Author: Independent Financial Analyst
[The Gist]: What's Really Happening
The official narrative you'll hear from CNBC and Bloomberg commentators sounds like a verdict: "Inflation is out of control, the Fed must raise rates, the economy is overheating." It sounds convincing, but it's a superficial reading of the numbers. It misses the main point: current US inflation is not a monetary phenomenon but a structural shift. The Federal Reserve cannot (and, in my deep conviction, does not want to) stop it with traditional methods.
The core PCE index rose to 3.3% year-over-year. That's indeed the highest since late 2023. But what's driving this increase? Let's break it down: 70% is the energy crisis (the blockade of the Strait of Hormuz pushed gasoline prices up 22% in two months). Another 20% is housing inflation, which is actually a lagging indicator of previous rate hikes. And only 10% is "classic" price pressure from overheated demand. Raising interest rates fights precisely that 10%. But it has no effect on gas station prices—those are determined by geopolitics. Simple math, right?
And here's the main paradox. The Atlanta Fed forecasts GDP growth in the second quarter of 2026 at 3.0%. That's not just resilience—it's a boom. The labor market is near full employment (unemployment rate 3.7% in May, new jobs at 215k per month). Inflation at 3.3% with GDP growth at 3.0% and unemployment at 3.7%—you know who this is an ideal scenario for? The current administration, five months before the elections. Workers are getting pay raises (nominal incomes up 5.2% year-over-year), corporations are posting record profits, and while inflation is high, it's too early to panic.
Timeline and Context
The PCE data for April 2026 was released by the US Department of Commerce on May 30, 2026. The reading was 3.3% versus 3.0% in March. But markets and media only paid attention now, in early June. Why the delay? Because news of the escalation in the Persian Gulf and expectations for the ECB coincided with the May CPI data, which turned out even higher—3.8% year-over-year. PCE is considered a "softer" indicator, but its rise to 3.3% is already a psychological threshold.
Here's how the energy shock unfolded:
| Period | Brent Price (avg) | Event |
|---|---|---|
| April 2026 | $82-85 | Stable market |
| May 2026 (after escalation) | $90-94 | Blockade of the Strait of Hormuz |
| June 2026 (forecast) | $92-96 | Fully reflected in gasoline prices |
The lag between oil price increases and gasoline price increases at the pump is 2-3 weeks. April's PCE did not fully reflect May's oil spike. June data (due out at the end of July) will likely show PCE at 3.6-3.8%. In other words, we're only seeing the tip of the iceberg.
At the same time, the labor market continues to surprise. The monthly ADP report (for May) showed private sector employment growth of 225k jobs—above the forecast of 180k. The services sector (education, healthcare, hospitality) was particularly strong. Wages rose 5.5% for job changers and 4.2% for those staying put—the highest rates since 2023. Consumer spending, which accounts for 68% of US GDP, rose 0.6% in April versus a forecast of 0.4%.
Who Wins and Who Loses
Winner number one: Corporate America, especially the oil & gas and aerospace sectors. ExxonMobil and Chevron report record quarterly profits: in May-June, refining margins rose 40% due to the gap between expensive oil and even more expensive gasoline. Boeing and Lockheed Martin benefit from rising military spending. Their stocks are hitting all-time highs. But there are less obvious winners: retail chains selling essential goods (Walmart, Costco). Their revenue is growing because people spend more on food and gas, cutting discretionary spending. And Walmart, like no other, knows how to profit from this.
The second winner: holders of inflation-hedged assets: gold, Bitcoin, real estate. Gold is testing levels of $2450-2500. Bitcoin, despite volatility, holds above $70k—institutions use it as a hedge against dollar depreciation. California and Texas real estate has risen 5-8% since the start of the year: rental rates are indexed to inflation.
The biggest loser: holders of fixed-income dollar bonds. The 10-year Treasury yield jumped to 4.7% (from 4.2% in April)—the market demands compensation for inflation. If you bought 10-year bonds a year ago at 4%, their price has now fallen 6-7%. This capital loss destroys any coupon income. Pension funds and insurance companies, which are required to hold government bonds by regulation, suffer especially. Their unrealized losses have already reached $200 billion industry-wide.
The second loser: borrowers with floating rates: credit card holders and small businesses. The average credit card rate has already exceeded 24%—an all-time high. Credit card delinquencies rose to 4.2% (highest since 2011). Small businesses that took loans at SOFR + 4% (effective rate around 10%) can no longer service their debt—their revenue isn't growing at 10% per year. Small business bankruptcies in May 2026 rose 30% compared to May 2025.
What the Media Isn't Telling You
The first and most important insight you won't find in official reports: the Fed manipulates the definition of "core inflation" to hide the real price dynamics. Core PCE excludes food and energy. But in 2026, energy is the driver of inflation. By excluding it, the Fed artificially downplays the problem. If you calculate "median PCE" (which includes all components), real inflation in April was 4.1%. And if you add import prices (up 8% due to a weak dollar), it's all of 5%. These numbers are not published in press releases. Convenient, isn't it?
The second omission: hidden subsidization of the economy through the budget deficit. While the Fed talks about "fighting inflation," the Treasury spends money like crazy. The budget deficit in fiscal year 2026 (October 2025 – September 2026) will reach $2.2 trillion, or 7.5% of GDP. This money flows into the economy through military orders, healthcare subsidies (Inflation Reduction Act), and infrastructure projects. The Fed raises rates, while the Treasury issues debt, stimulating demand. This is a schizophrenic policy that guarantees inflation won't fall below 3% for the next two years.
The third: the role of the 2026 elections. Neither Warsh (Fed chair) nor Trump are interested in sharp rate hikes before the November elections. Raising rates would kill the housing market (mortgages already at 8.5%) and cause a recession. A 20% stock market drop would mean defeat for the Republicans. There is an unspoken agreement: the Fed will raise rates by 25 bps on June 24 (for show), then pause until December. Inflation will be blamed on "external factors" (Middle East, China). Markets will live with 3-4% inflation as the new normal. And you know what? It works—at least for those sitting in the White House.
Forecast: Next 30 Days and 90 Days
30 days (by July 10, 2026): The June FOMC meeting (June 24) will bring a 25 bps rate hike to the 5.50-5.75% range. It will be a "dovish" hike with "data-dependent" rhetoric and a hint of a pause. Inflation expectations will settle at 3-3.5%. The 10-year Treasury yield will remain in the 4.6-4.9% range. The stock market (S&P 500) will correct slightly by 2-3% after the hike but quickly recover.
90 days (by September 10, 2026): Inflation will peak in July (PCE up to 3.8%) and begin to slowly decline toward September (to 3.5%) due to base effects. The Fed will not raise rates in September, maintaining a pause. The November elections will become the dominant factor. If Democrats win (unlikely), Warsh will be fired and a rate-cutting cycle will begin. If Republicans win (base case), the Fed will keep rates high until mid-2027 to defeat inflation. The market will price in the second scenario, and the dollar will strengthen by 3-5%.
Editorial Forecast
Asset: US Dollar Index (DXY). Direction: moderate rise in the next 24-72 hours amid strengthening hawkish expectations for the Fed rate due to high inflation. Key levels: current value — 104.2; target — 105.0 (test of March highs); support — 103.5. Confidence level: medium (65%), as the market has already partially priced in the rate hike. Main risk: if Jerome Powell (or Warsh) makes an unexpectedly dovish statement about a pause, the dollar could fall to 102.8. This is the editorial opinion, not an investment recommendation.
— Editorial Team