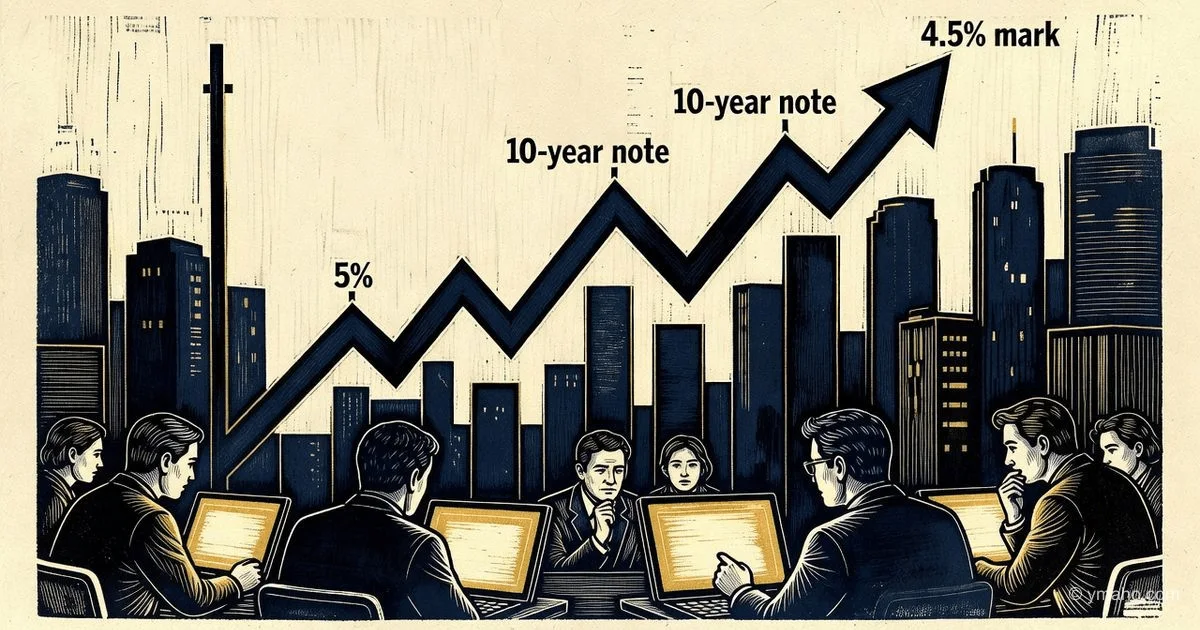
US Treasury Bonds Fall in Price: 10-Year Yield Reaches 4.5%
The yield on 10-year US government bonds rose to 4.5% from 4% in early March, the highest level since 2007 for 30-year bonds. The yield increase, driven by expectations of tight Fed policy, effectively does part of the central bank's job of tightening financial conditions.
A 4.5% yield is not "high" — it's the new normal: why the bond market is finally waking up after 15 years of slumber
Author: independent financial analyst
When the 10-year US Treasury yield hits 4.5%, retail investors start to panic. They remember 2020-2021, when 10-year notes yielded 0.5-1.0%, and see the current level as an anomaly. But those sitting in trading rooms on Wall Street know: 4.5% is not an anomaly. It's a return to the norm we haven't seen since 2007.
And this return is happening for three reasons that are barely discussed in news headlines: first, the Fed will no longer rescue the bond market through endless purchases; second, the US budget deficit has settled at 6.3% of GDP and isn't going away; third, Japanese and European investors, who subsidized US debt for decades, have started to exit positions.
I'll break down why 4.5% is not the peak, what actually determines Treasury yields, and provide an insight that most analysts miss when looking at the yield curve.
[The Gist]: What's Really Happening
The 10-year US Treasury yield is trading around 4.5-4.55%. But if you think that's high, look at history: from 1962 to 2007, the average 10-year Treasury yield was about 6.3%. What we now call "high rates" is actually just a return to pre-crisis levels after 15 years of abnormally low rates caused by QE and zero interest rate policy (ZIRP).
The yield increase from 4.0% in early March to 4.5% in mid-June occurred amid several simultaneous shocks. First, May inflation data showed CPI at 4.2% — well above expectations. Second, the war with Iran and the closure of the Strait of Hormuz pushed up energy prices, which translates into consumer inflation with a 1-2 month lag. Third, the labor market remains surprisingly strong: May Non-Farm Payrolls showed an increase of 172,000 jobs versus a forecast of 85,000.
But the most important thing the news misses: the 10-year yield is not just about inflation and the Fed rate. It's also about the "term premium" — compensation to investors for holding long-term bonds amid uncertainty. This premium was artificially suppressed by years of Fed purchases, and now it's returning. According to ING estimates, the fair level for the 10-year yield in current conditions is 4.25-4.5%. So we're already there.
Timeline and Context
To understand how we got to 4.5%, we need to look at key dates over the past two weeks. This is a story of how good news for the economy became bad news for bonds.
| Date | Event | Impact on 10-Year Yield |
|---|---|---|
| June 5, 2026 | May Non-Farm Payrolls released: +172,000 (forecast 85,000) | Yield jumps 10-12 bps in a day, market prices in a Fed rate hike |
| June 5, 2026 | Cleveland Fed's Hammack says: "A rate hike could soon become appropriate" | First public statement by an FOMC member about a possible hike since 2023 |
| June 8-9, 2026 | Escalation of conflict with Iran: US strikes Iranian targets | Oil rises, 10-year yield climbs to 4.54% |
| June 10-11, 2026 | May CPI released: 4.2% year-over-year (forecast 4.0%) | Yield consolidates around 4.5%, market fully rules out rate cuts in 2026 |
| June 11-12, 2026 | Trump questions Iran deal after attack on Indian vessel | Oil corrects higher, yield returns to 4.5% |
| June 12, 2026 | SpaceX holds largest IPO in history | Partial capital outflow from Treasuries into equities |
| June 17, 2026 (expected) | FOMC meeting — dot plot released | Market expects rate cuts to be removed from the dot plot |
Key takeaway from this timeline: the bond market no longer reacts to every Fed statement as it used to. Investors look at real data — inflation, employment, geopolitics — and make decisions independently. This is a sign of a healthy market, but also a source of volatility.
It's worth noting that the 10-year yield has risen to 4.5% several times in 2025, but each time it quickly retreated. The current episode differs because the fundamental drivers (budget deficit, end of QT, political uncertainty) have become more persistent.
Who Wins and Who Loses
Winners:
Investors who moved to the short end of the curve (T-bills, 2-year Treasuries). The 2-year yield is currently around 4.09%, higher than the 10-year (4.48%) — the curve remains inverted. Those holding short-term paper get nearly the same yield with less risk. Moreover, Wells Fargo predicts the Fed will start buying Treasury bills to manage reserves, supporting short-term paper prices.
Banks and insurance companies that buy Treasuries to meet regulatory requirements. For them, higher yields mean higher net interest income. Regional banks, which were forced to hold large Treasury portfolios after the SVB collapse in 2023, benefit especially.
Investors in high-yield bonds (junk bonds). When risk-free Treasury yields rise, high-yield spreads to Treasuries can narrow as investors seek yield. However, this is a double-edged sword: if Treasury yields continue to rise, low-rated companies will face higher borrowing costs.
Cash holders (money market funds). Rates on short-term instruments (Fed funds, repo, T-bills) follow Fed policy expectations. If the market prices in a rate hike, money market fund yields rise. Currently, 3-month T-bills yield about 4.0-4.1% — the best real yield (adjusted for inflation) since 2008.
Losers:
Holders of long-term Treasuries (30-year bonds) bought in 2024-2025. The 30-year yield has already reached 4.97% and is moving toward 5.2%. If you bought a 30-year bond at a price corresponding to a 3.5% yield, your loss is 15-20% of face value. This is the largest sell-off in long-term bonds since 2022.
Issuers of investment-grade corporate bonds (IG). The rise in the base Treasury yield automatically increases borrowing costs. Estimates suggest that each 1 percentage point increase in the 10-year yield raises annual interest expenses for the US corporate sector by about $30-40 billion.
Technology companies with high debt loads and low profitability. Their stocks are particularly sensitive to rising rates, as their future cash flows are discounted at a higher rate. The Nasdaq has already corrected 4-5% since early June.
The US Treasury. The higher the yield, the more expensive it is to service government debt. With national debt around $36 trillion, each 1 percentage point increase in the average servicing rate adds $360 billion to annual interest expenses. Wells Fargo forecasts a budget deficit of $2 trillion in fiscal year 2026.
What the Media Isn't Saying
Insight you won't find in news about the 4.5% yield:
The rise in the 10-year Treasury yield to 4.5% is not the result of Fed actions or inflation. It is the result of the Bank of Japan ceasing to be the largest foreign holder of US debt.
Let me explain the mechanics. Throughout 2010-2020, Japanese institutional investors (pension funds, insurance companies) were among the largest buyers of long-term Treasuries. The reason: yields in Japan were near zero, while in the US they were 2-3%. The rate differential (carry) allowed them to profit by hedging currency risk through forwards.
But now the situation has changed dramatically. The Bank of Japan is raising rates — expected to hike to 1% at its June 15-16 meeting. Japanese yields are rising, and the cost of hedging currency risk (basis swap) has turned negative. As a result, Japanese investors can no longer profit from the carry trade in Treasuries. They have started selling US bonds and repatriating capital to Japan.
How much have they sold? Exact figures are unavailable, but Japanese holdings of Treasuries have fallen from $1.3 trillion in 2021 to about $1.0 trillion now. That's $300 billion in net sales over 5 years — with acceleration in 2026. Every day the Bank of Japan raises rates, this process speeds up. And it pressures Treasury prices (raises yields) regardless of what the Fed does.
What else is hidden: The 10-year yield is not just a "rate" but also a "credit spread" for the US as a borrower. Wells Fargo explicitly states that the current spread of 10-year yields to SOFR (about 40-50 bps) is "the pure price paid for elevated deficits." In other words, the market demands additional compensation because the US government cannot control its spending. If the deficit remains at 6-7% of GDP (and it will), this premium is here to stay.
Forecast: Next 30 Days and 90 Days
Next 30 days (through mid-July 2026):
The 10-year Treasury yield will fluctuate in the range of 4.40-4.70%. The key date is the FOMC meeting on June 17. Even if the Fed leaves rates unchanged (97% probability), the dot plot will signal readiness to hike. This will support yields at current levels.
I expect the yield to reach a local peak of 4.65-4.70% in the last week of June, when the market fully prices in a rate hike in November (63% probability per FedWatch). Then a slight correction to 4.40-4.45% is possible if weak retail sales or PMI data emerge.
Also watch rates in Europe and Japan. If the Bank of Japan raises rates to 1% and delivers a hawkish signal, Japanese investors may accelerate Treasury sales, pushing yields up another 10-15 bps.
Next 90 days (through mid-September 2026):
The 10-year yield will likely exceed 4.75% and could test 5.0% in August-September. Reasons:
- Inflation will remain high. May CPI at 4.2% is not a one-time spike. The energy shock from the war with Iran will continue to feed into prices for another 2-3 months. I expect June CPI in the range of 4.0-4.3%.
- The Fed will signal readiness to hike. Even if no actual hike occurs until November, the market will price it in. And that automatically lifts long-term yields.
- Treasury supply remains high. The Treasury must finance a $2 trillion deficit. Wells Fargo expects no changes in coupon bond auctions until 2027. That means $60-80 billion in new 10-year notes every three months.
Alternative scenario (20-25% probability): if the conflict with Iran suddenly resolves, oil falls to $75-80, inflation expectations decline, and yields could retreat to 4.0-4.2%.
What this means for assets:
- Long-term Treasuries (TLT, EDV): continue to fall. I expect an additional decline of 5-7% by the end of Q3.
- Equities (S&P 500): correction of 5-10% from current levels, especially in high-multiple sectors (tech, consumer discretionary). The correlation between yields above 4.5% and stocks has turned negative.
- Dollar (DXY): moderately strengthens to 105-106, as higher yields attract foreign capital.
- Gold: under pressure. Real Treasury yields (yield minus inflation) have risen to about 0.5-1.0%, making gold less attractive as a safe haven.
Editorial Forecast
Asset: TLT (iShares 20+ Year Treasury Bond ETF) or direct long-term Treasuries
Direction: moderate decline in the next 24-72 hours with possible short-term bounces
Key levels: current 10-year yield 4.48-4.50%; TLT price support at $88-89 (psychological low), resistance at $92-93 (50-day moving average). If yield breaks 4.55%, next target is 4.65-4.70%
Confidence level: high for short-term bearish trend, but medium for exact amplitude
Main risk: sudden de-escalation of the conflict with Iran and sharp drop in oil prices. If Trump announces resumption of talks and a temporary halt to strikes, oil could fall 10-15% in 24 hours, inflation expectations would decline, and the 10-year yield could retreat to 4.2-4.3% within days. Probability of this scenario in the next 72 hours is 15-20%, but it rises daily as both sides suffer losses.
The editorial opinion is not an investment recommendation. All decisions to buy or sell assets are yours alone.
— Editorial Team