Two-Year US Treasury Yield Hits 15-Month High
A sharp increase in US jobs in May (172,000 vs. forecast of 80,000) has heightened expectations of a Fed rate hike. The two-year bond yield surged more than 11 basis points to 4.15%.
Analysis: Two-Year US Treasury Yield Hits 4.15% — Why the Market Is Wrong and the Curve Has Been Lying for 803 Days
Author: Independent Financial Analyst
Date: 2026-06-08
Key News: The yield on two-year US Treasury notes jumped more than 11 basis points to 4.15% — the highest since February 2025. The trigger: strong May employment data (172,000 jobs vs. forecast of 80,000), which reinforced expectations of a Fed rate hike.
[The Gist]: What's Really Happening
The market is misreading the yield curve again. Two-year yields rose to 4.15%, and everyone is talking about a "hawkish signal." But in reality, the two-year isn't about today's Fed rate. It's about the market no longer believing in a soft landing. Let's break down the math: 4.15% on the two-year is the average expected rate over the next two years. If the current Fed rate is 4.25-4.50% (after the May cut), the market is pricing in that the rate will be lower a year from now. Otherwise, the two-year would be above 4.50%. This is not a hawkish signal. It's the market saying: "We believe the Fed will cut rates, but the economy is so strong that the cuts will be very slow."
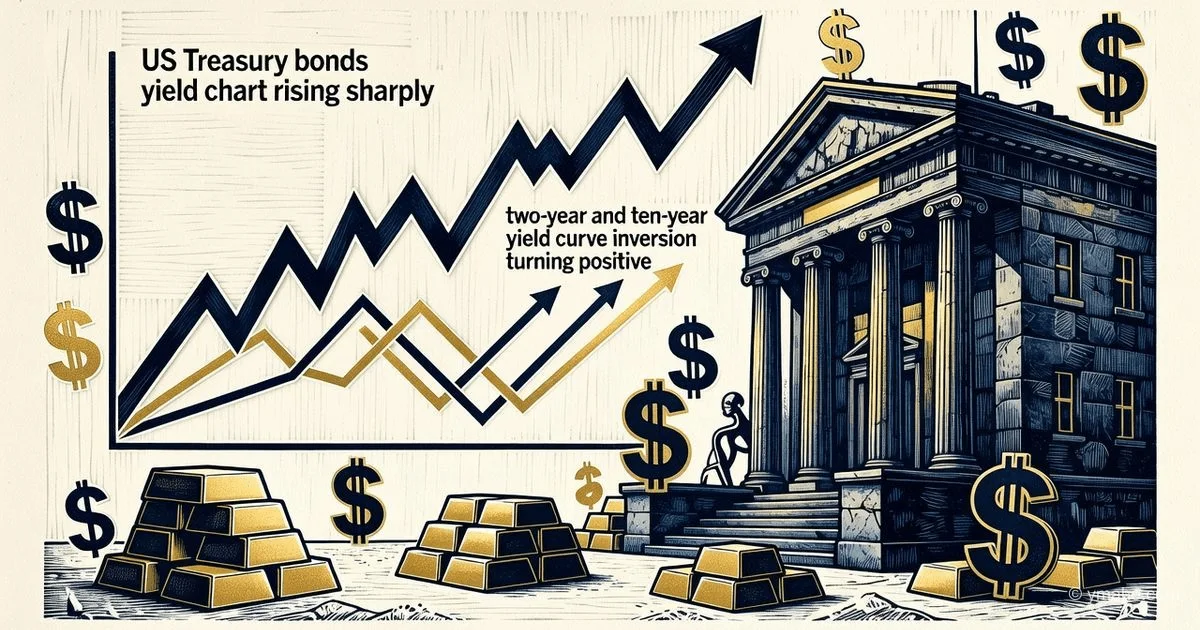
But what's really happening? The yield curve has been inverted for 803 days — the longest inversion in modern bond market history. Now that it's starting to normalize (the spread between 10-year and 2-year has turned positive), everyone breathes a sigh of relief. And that's the most dangerous mistake. History says the opposite: inversion predicts recession, but the recession itself begins not during the inversion, but when the curve normalizes. 1989 — curve normalized, recession a year later. 2000 — normalized, recession within months. 2007 — normalized, then financial crisis. Now — the same pattern.
And the key insight missing from all publications: the mechanism of this normalization is not optimistic but alarming. There are two types of curve normalization: "bull steepening" (short rates fall faster than long rates) and "bear steepening" (long rates rise faster than short rates). We are currently in a bear steepening: the 10-year yield rose to 4.55%, and the 30-year closed above 5% for the first time since 2007 — at 5.025%. Long rates are rising due to deficit and inflation concerns, while short rates are rising because the market expects the Fed won't cut rates aggressively. This is a classic pre-recession picture.
Timeline and Context
Let's start with the key date — June 5, 2026. On Friday morning, May employment data is released: 172,000 new jobs vs. forecast of 80,000. The labor market continues to surprise to the upside. By the close of trading, the two-year yield jumps 11 basis points to 4.17%. That's the highest since February 2025. The 10-year ends the day at 4.55%.
The previous key moment — May 29, 2026. The US Treasury holds an auction for $25 billion in 30-year bonds. The auction clears at a yield of 5.025%. This is the first close above 5% on 30-year paper since 2007 — the very same 2007 that preceded the financial crisis. Traders around the world freeze. No one makes loud statements. The number 5.025% speaks for itself.
A few weeks earlier — May 22, 2026 — Kevin Warsh is sworn in as the 11th Fed Chair. This matters because Warsh is known as a "hawk." He has repeatedly stated that the neutral rate is structurally higher than models suggest. The market expects rate cuts to be slower under him than under Powell.
Now add context that Bloomberg doesn't cover. The 2/10 curve inversion lasted 803 consecutive days — from July 2022 to September 2024. This is the longest inversion period on record, dating back to 1955. Throughout, analysts said: "This time is different; the inversion doesn't predict recession because the Fed aggressively fought inflation." But now the inversion is over, the curve has normalized — and the moment of truth has arrived. History says that on average, recession occurs 48 weeks after the first inversion, or 13-18 weeks after the curve returns to positive territory. We are currently in that window.
Winners and Losers
Biggest Loser: Hedge funds that held a steepener trade — long short-term bonds and short long-term bonds. This strategy made money throughout 2025 as the curve normalized. But now, with the 10-year at 4.55% and the 30-year above 5%, further steepening becomes risky. If a recession starts, long rates will fall (investors flee to safe 10-year bonds), and short rates will fall even faster (the Fed will cut rates). That's a bull steepening, which loses money for steepener trades. Estimates suggest that over the past two weeks, funds short the long end have lost about $2-3 billion.
Second Loser: US regional banks. They hold massive bond portfolios purchased in 2020-2021 at low rates. Now yields have risen, bond prices have fallen. Unrealized losses in the banking system are estimated at $350-400 billion. As long as banks hold these securities to maturity, losses aren't realized. But if depositors start withdrawing money (as in March 2023 with Silicon Valley Bank), banks will have to sell bonds on the market — and losses become real. A 4.15% yield on two-year bonds means the price of bonds bought at 1-2% has fallen 8-10%. Not a catastrophe, but a trigger for panic.
Winner #1: Insurance companies and pension funds that buy long-term bonds to match liabilities. Yields above 5% on 30-year bonds are the best since 2007. They lock in this yield and sleep soundly. Notably, Japanese pension funds (the largest holders of US Treasuries with $1.1 trillion) were active buyers at the May 29 auction.
Unobvious Winner: Issuers of floating-rate notes (FRNs). When Treasury yields rise, corporate bond spreads typically tighten because investors seek extra yield. Investment-grade companies can now issue FRNs at SOFR + 80-100 basis points, lower than in 2023 (SOFR + 150). For issuers, this is cheap financing.
Hidden Loser: Traders holding long gold positions as a hedge against falling real rates. The real yield on 10-year bonds (nominal yield minus inflation) is currently around 2% — a high level. Gold pays no coupon. When real rates are high, holding gold is unattractive. Over the past month, gold has fallen about 4%, despite geopolitics. If real rates stay high, gold could drop to $4,000 per ounce.
What the Media Leaves Out
The key insight missing from publications: the two-year yield isn't as important as the spread between two-year and ten-year yields. Historically, recessions are preceded not by the inversion itself, but by the moment when the curve begins to normalize after a long inversion. This is called the "transition from inversion to normalization." In 1989, after inversion, the curve normalized, and a year later recession began. In 2000 — same. In 2007 — same, then financial crisis. Now the inversion lasted 803 days — a record. Normalization has already begun. The media writes: "The curve is normalizing, that's a good sign." But history says it's a warning, not a comfort.
Second omission: new Fed Chair Kevin Warsh. He was appointed on May 22, 2026, and this changes the game. Warsh is not Powell. Powell was a dove compared to him. Warsh has publicly stated that the neutral rate should be above 3%, not 2.5% as previously assumed. This means that even when the Fed starts cutting rates, they might stop at 3.5-4%, not 2.5-3%. The market hasn't fully priced in this new reality. The two-year yield at 4.15% implies that in two years, the Fed rate will be around 3.75-4%. That's higher than old forecasts, but may still be insufficient if Warsh turns out to be even more hawkish.
Third omission: the international factor. Yields on Japanese and European bonds are rising. Japan is normalizing its monetary policy after decades of zero rates. The European Central Bank continues to raise rates despite weak growth. When yields in other developed countries rise, US investors demand a premium to hold US Treasuries. This adds pressure on the long end of the curve. Many analysts miss this global context, focusing only on domestic US factors.
Forecast: Next 30 Days and 90 Days
30 Days (through July 8):
The two-year yield will likely stay in the 4.0-4.3% range. Key date: the Fed meeting on June 24-25. This will be the first meeting under Kevin Warsh. I expect the Fed to hold rates steady (70% probability), but the rhetoric will be hawkish. Warsh will signal that rate cuts in the second half of the year are not guaranteed. This will support two-year yields at current levels.
If inflation data (released June 14) shows an acceleration above 3.2%, the probability of a rate hike in July rises to 40-50%. In that scenario, two-year yields could jump to 4.5% — the highest since 2007. My base forecast for end-June: 4.1-4.2% on two-year, 4.6-4.7% on ten-year.
90 Days (through September):
By September, I expect the curve to continue normalizing, not because the economy is strong, but because the market will start pricing in a recession. This will be a "bull steepening" — short rates will fall faster than long rates. By the end of Q3, the two-year yield could drop to 3.6-3.8%, while the ten-year stays around 4.3-4.5%. The spread between them will widen to 50-70 basis points.
But there is an alternative scenario. If the US budget deficit continues to grow and the Treasury is forced to increase long-term bond issuance, the 10-year yield could rise to 4.75-5%. That's a "bear steepening," signaling more serious problems. I estimate this scenario at 30%.
The best strategy now is not to hold naked long positions in bonds, but to use a bullet strategy: buy bonds with 3-5 year maturities, which are less affected by long-end volatility, and still offer decent yields around 4.2-4.4%. Avoid 30-year bonds — they are too sensitive to deficit concerns.
Editorial Forecast
Asset: US Dollar Index (DXY) — ICE futures
Direction: Up in the next 48-72 hours to 100.2-100.5, driven by the persistent yield gap between the US and other developed countries and risk aversion
Key Levels: Resistance at 100.00 (psychological level), support at 99.20 (50-day moving average); a break above 100.00 opens the path to 101.00; a fall below 99.00 invalidates the bullish scenario
Confidence Level: Medium (60%) for a rise in the next 24 hours; high (75%) for the index staying above 99.50 after Friday
Main Risk to Forecast: Unexpectedly weak inflation data on June 14 (below 3%) or a Fed statement signaling readiness to cut rates — both could send the dollar down 1-1.5% in a few days
This analysis represents the private opinion of the editorial board and is not an investment recommendation.
— Editorial Team